How Are Crude Oil Prices and the S&P 500 Correlated?
Historically, crude oil prices and the S&P 500 index have influenced each other.
April 22 2016, Published 3:44 p.m. ET

Crude oil and the S&P 500
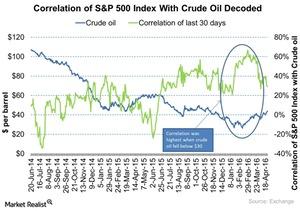
Historically, crude oil prices and the S&P 500 index have influenced each other. Crude oil (USO) prices have been falling since June 2014. The correlation of the S&P 500 index and crude oil was highest when crude fell below $30, and lowest when crude oil was at around $100.
Why the equities market correlates with crude oil
The chart above shows the correlation between crude oil and the S&P 500 index at different price levels. Oil is an important driver of the world economy. Energy demand constitutes a significant portion of US consumer spending. Equities and crude oil move in a cycle. A sudden rise in prices pressurizes consumer spending and strains economic growth in consuming nations. On the other hand, a sudden fall in crude oil prices could indicate a slowdown in economic activity. Plus, a sharp drop in crude oil prices could affect other industries that support it, employment in the sector, and the financial sector that lends to it.
The S&P 500 has a 6.8% exposure to the energy sector. Therefore, when crude fell below $30, the S&P 500 had the highest last 30-day correlation with crude oil. When crude oil reached new highs because of supply issues, markets were less correlated or had a negative correlation with crude oil.
Broad market ETFs
Broad market ETFs such as the PowerShares QQQ ETF (QQQ) and the iShares Core S&P 500 ETF (IVV) are influenced by the correlation between crude oil and the S&P 500. Oil-weighted stock such as Northern Oil & Gas (NOG), Kosmos Energy (KOS), and Denbury Resources (DNR) are affected by lower crude oil prices.
