Is There Overcapacity in the Airline Industry?
In February 2016, the airline capacity of the eight major airlines exceeded their traffic growth by an average of 2%.
March 28 2016, Published 12:47 p.m. ET

Capacity growth surpasses traffic for some
The lower oil price environment is helping airlines generate extra cash on their balance sheets, which they have been aggressively using to restructure their fleets. Airline capacity is measured using available seat miles (or ASM). ASM is calculated as the number of seats available divided by the number of miles.
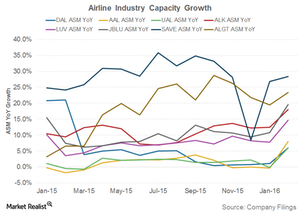
In February 2016, the airline capacity of the eight major airlines exceeded their traffic growth by an average of 2%. Spirit Airlines (SAVE) saw the highest capacity growth of 28%, exceeding its traffic by just 0.5%. Allegiant Airlines (ALGT) followed with capacity growth of 23% year-over-year (or YoY), which exceeded its capacity growth by 2.4%. Respectively, JetBlue Airways’ (JBLU) and Southwest Airlines’ (LUV) capacity numbers grew by 20% YoY and 15% YoY, exceeding their traffic by 0.5% and 1%.
Both Delta Air Lines (DAL) and United Continental (UAL) grew their capacity by 6% YoY, which exceeded their capacity by 1%. Alaska Air Group (ALK) and American Airlines (AAL) reported the highest discrepancy among capacity and traffic numbers. ALK’s capacity growth of 18% exceeded its traffic growth by 4% while AAL’s capacity growth of 8% exceeded its traffic growth by 5%.
Outlook
Although capacity addition is extremely important for airlines, overcapacity situation can be dangerous. This is because the airline industry is well-known for its boom and bust cycles. They usually tend to increase capacity in good times, only to repent when cycles turn downward.
Despite the high capacity growth seen in the first two months of 2016, the three major airlines—AAL, UAL, and DAL—are expected to grow their 1Q16 capacity by only 2%–3%.
Regional carriers are expected to continue growing their capacity at a high pace. LUV plans 5%–6% capacity addition, JBLU plans 15%–16% capacity addition, SAVE plans 27.5% capacity addition, and ALGT plans 15%–19% capacity addition.
The airlines’ aggressive capacity additions are bound to negatively affect their utilization at least for the short term, which we will discuss in our next article.
The PowerShares Dynamic Leisure & Entertainment Portfolio ETF (PEJ) invests 5% of its holdings in each of UAL, DAL, and AAL. PEJ invests 2.7% in ALK.
