Why Overall Demand Tanked for 2-Year Floating-Rate Notes
Overall, $13 billion worth of floating-rate notes were auctioned, the same as in February’s auction.
Nov. 20 2020, Updated 3:47 p.m. ET
Two-year floating-rate notes
The US Department of the Treasury introduced two-year floating-rate notes in January 2014. A floating-rate note is a debt security. Its takes its name from its variable interest payment. The reference for its rate is a benchmark like LIBOR (Intercontinental Exchange London Interbank Offered Rate) or the three-month Treasury yield. The security’s interest payments rise and fall depending on prevailing market rates. Thus, floating-rate notes have almost no interest rate risk.
Mutual funds like the HSBC U.S. Treasury Money Market Fund (HTYXX) and the U.S. Government Securities Ultra-Short Bond Fund (UGSDX) provide exposure to Treasury floating-rate notes. ETFs like the WisdomTree Bloomberg Floating Rate Treasury Fund (USFR) also provide exposure to floating-rate notes issued by the Department of the Treasury.
Key takeaways
- The auction was held on March 23, 2016.
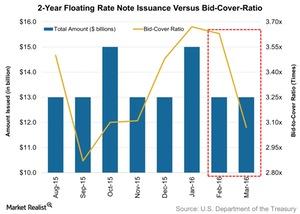
- Overall, $13 billion worth of floating-rate notes were auctioned, the same as in February’s auction.
- The high discount margin remained unchanged at 0.24% in the March auction.
Overall demand tanked
The overall demand, as represented by the bid-to-cover ratio, tanked by 15.4% to 3.1x compared to 3.6x at February’s auction. In a rising interest rate environment, interest payments rise on the floating-rate notes. However, the recent Federal Reserve meeting indicated a dim possibility of a rate hike in April based on global events and domestic factors. Thus, the overall demand for two-year floating-rate notes plunged.
Market demand rose
Market demand rose to 44.4% of the accepted competitive bids in March, compared to 39.2% in February’s auction.
The percentage of direct bidders fell to 3.2% in March from 10.0% in February’s auction. Direct bids include bids from domestic money managers like State Street (STT) and American International Group (AIG). Indirect bids include bids made by foreign central banks and indicate overseas demand. They surged, making up 41.2% of the auction in March as compared to 29.2% in February.
Due to a rise in demand, primary dealer takedown fell to 55.6% from 60.8% at February’s auction. Primary dealers act as market makers. They take up excess supply of auctioned securities. They include firms like Morgan Stanley (MS), Citigroup (C), and J.P. Morgan (JPM).
Floating-rate notes
Floating-rate notes see their interest rate payments rise when interest rates rise. This is in contrast to regular Treasuries, which decrease in value. An increase in rates affects the overall bond market, including mutual funds investing in Treasuries and corporate bonds.
From the next article onward, we’ll analyze the Treasury Bill auction activity last week.