Newfield Exploration Stock Is Up, but for How Long?
With the recent rally in crude oil prices, Newfield Exploration (NFX) stock has been on an uptrend. On March 1, 2016, it crossed its 50-day moving average for the first time in 2016.
March 30 2016, Published 10:13 a.m. ET

Newfield Exploration’s moving averages
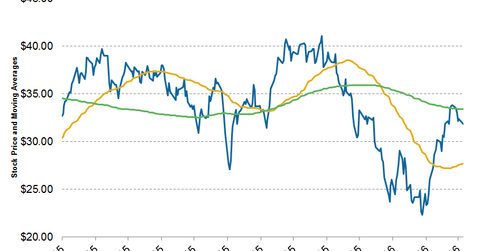
Newfield Exploration (NFX) stock mostly saw ups in 2015. However, in December 2015, after crude oil prices (USO) fell to sub-$40 levels, NFX stock started declining, as you can see in the graph below. But with the recent rally in crude oil prices, NFX stock has been on an uptrend. On March 1, 2016, it crossed its 50-day moving average (or DMA) for the first time in 2016. It continues to trade above its 50-DMA. On March 28, 2016, it was trading ~15% above its 50-DMA.
NFX stock briefly crossed its 200-DMA in mid-March but wasn’t able to sustain those levels. As of March 28, 2016, NFX was trading ~4.5% below its 200-day moving average.
Year-over-year, NFX stock has fallen by 7.5%.
A quick earnings review
Newfield Exploration reported a fiscal 2015 adjusted net income of $164 million. This compares to an adjusted net income of $248 million in fiscal 2014.
Many upstream companies were hit by weak crude and natural gas prices in 2015.
- Hess (HES) recorded adjusted net losses of $1.1 billion in fiscal 2015 compared to earnings of $1.2 billion in fiscal 2014.
- Apache (APA) reported a net loss of $130 million in fiscal 2015 versus earnings of $2 billion in fiscal 2014.
- Marathon Oil (MRO) reported a fiscal 2015 adjusted net loss of $869 million. This compares to adjusted net income of ~$1.2 billion in fiscal 2014.
- Concho Resources (CXO) reported a net income of $110.8 million in fiscal 2015 versus $443.6 million in fiscal 2014.
These companies combined make up ~0.3% of the iShares Core S&P 500 ETF (IVV).
Next, we’ll take a look at Newfield Exploration’s key management objectives.
