Behind Vivint Solar’s Key Operational Metrics
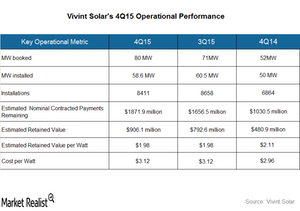
Vivint Solar’s estimated nominal contracted payments remaining increased by $251.4 million during 4Q15, compared to $214 million during 3Q15.
March 17 2016, Published 3:32 p.m. ET

Why metrics matter
It’s important to know a company’s key operational metrics in order to understand and compare the performance of one period with another. The same metrics can be used to compare the operational performances of downstream solar (TAN) companies like Sunrun (RUN), Vivint Solar (VSLR), and SolarCity Corporation (SCTY). SunPower (SPWR), notably, derives a significant portion of its revenue from downstream operations.
Megawatts booked and megawatts installed
Megawatts booked includes the total capacity of solar energy systems that are sold to customers or are subject to an executed customer agreement, after considering cancelations during the applicable period. Selling and marketing costs can be estimated using this operating metric as well. Vivint Solar’s MW (megawatts) booked value for 4Q15 came in at 80 MW, compared to 71 MW during 3Q15 and 52 MW in 4Q14.
Megawatts installed represents the total production capacity of solar energy systems that are installed in a particular period. This metric is an indicator of asset growth during a period and is used in the estimation of G&A (general and administrative) expenses per watt. Vivant’s MWs installed in 4Q15 came in at 58.6 MW compared to 60.5 MW in 3Q15 and 50 MW in 4Q14.
Estimated nominal contract payments remaining
This metric represents the sum of the remaining cash payments that Vivint Solar has to receive from its customers for the systems installed over the term of their agreement. Vivint’s estimated nominal contracted payments remaining increased by $251.4 million during 4Q15, compared to $214 million during 3Q15. As of December 31, 2015, the total value of future contract payments stood at almost $1.9 billion, compared to ~$1.7 billion at the end of 3Q15 and just over $1 billion at the end of 4Q14.
Estimated retained value
Estimated retained value represents the net cash flows (discounted at 6%) that a company expects to receive from long-term customer contracts, after deducting any cash distribution to fund investors and estimated operating expenses for systems installed as of the measurement date. A higher estimated retained value represents higher future cash flows from operations for the company.
Vivint’s estimated retained value for 4Q15 came in at $906.1 million, compared to $792.6 million in 3Q15 and $480.9 million in 4Q14.
Cost per watt
Cost per watt represents a company’s estimated retained value per watt of installed capacity under long-term customer contracts. For Vivint, cost per watt remained flat compared to 3Q15 but decreased by nearly 6% on year-over-year basis.
Cost per watt is also the sum of all operating costs incurred per watt of installed capacity in a particular period, after considering cancelations. Notably, a lower cost per watt implies higher operational efficiency. Vivint’s cost per watt in 4Q15 $3.12, the same as it was in 3Q15, but it was up from the $2.96 it saw in 4Q14.
