Gold-Oil Ratio Is at a Historic High: Why Isn’t the Bottom Near?
A rise in the ratio can be correlated the corresponding rise in gold prices. An increase in the ratio indicates that gold is more expensive than crude oil.
Feb. 25 2016, Updated 8:07 a.m. ET

Gold-oil ratio measures crude oil depth
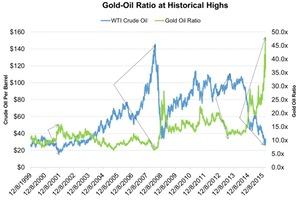
Crude oil (USO) tends to move at par with a change in the gold-oil ratio. When the ratio reaches a new low and a new high, it indicates the flip in crude oil’s continuing trend. The ratio measures how many barrels of crude oil can buy 100 ounces of gold (GLD). On November 15, 2001, when crude was at the low of $17.45, the ratio increased to 15.77x. This was a new high for the ratio. Then, the trend in the crude oil market reversed and crude followed an uptrend.
The rise in the ratio can be correlated to the corresponding rise in gold prices. An increase in the ratio indicates that gold is more expensive than crude oil. A fall in the ratio indicates that oil is more expensive than gold. The ratio reached a high of 47.61x as of February 11, 2016, when crude reached a multiyear low of $26.21 on a closing basis. However, the ratio also points to the fact that the oversupplied crude oil market was intentional. It made crude relatively cheaper. Until oil exporters agree to a production cut, oil will be cheaper than gold.
From 2003 to 2007, the crude oil demand rose due to emerging economies. The ratio was 9.5x–10x. It implies that crude rose faster than gold. However, from June 2014 to date, the ratio stood at 21x–22x compared to its 15-year average of 13.29x. Apparently, the oversupply concern is already factored into crude oil’s price. Upstream companies such as ConocoPhillips (COP), Anadarko Petroleum (APC), and Hess (HES) posted negative adjusted earnings per share of $0.9, $0.57, and $1.4 in 4Q15 due to the fall in crude oil.
The above graph clearly shows the importance of the ratio in crude oil pricing theories.
