How Gold Correlates with the S&P 500 Index
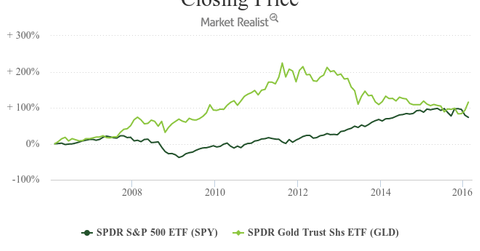
Since July 2011, the S&P 500 Index has gained about 62% and touched its high of 2130 in July 2015. During the same period, gold (GLD) has lost about 92%.
Feb. 17 2016, Published 1:34 p.m. ET

Gold as a safe-haven asset
In the last five years, the S&P 500 Index has had a negative correlation factor of 0.89 with the SPDR Gold Shares ETF (GLD). This analysis points toward the fact that investors normally prefers gold during an equity market rout.
Gold as a safe-haven asset derives its importance when international turmoil starts. After the subprime crisis, gold gained about 145% from the lows of September 2008 to its highs in July 2011.
[marketrealist-chart id=1055215]
Since July 2011, the S&P 500 Index has gained about 62% and touched its high of 2130 in July 2015. During the same period, gold (GLD) has lost about 92%. Investors must understand that when equity markets start to outperform, gold loses its shine. Riskier assets like equities tend to deliver better returns than gold. The above chart shows the correlation between the S&P 500 Index (SPY) and gold.
Most portfolio managers start to reduce their holdings in a safe asset class like gold and start investing in the equity market. On a fundamental basis, when the earnings cycle begins to pick up, fund managers start to rotate the money to equities and other riskier asset classes. However, when the earnings cycle starts to saturate or fall, money tends to find safe assets such as gold.
For example, oil and gas stocks ConocoPhillips (COP), Apache Corp. (APA), Denbury Resources (DNR), and Pioneer Natural Gas (PXD) have fallen 39.2%, 24.6%, 71.6%, and 18.8%, respectively, over the last three months as investors were anticipating weak earnings.
In the next part of this series, we will analyze the movement of the yen with the S&P 500 Index.
