How Does GNC Holdings Compare to Its Peers?
GNC’s peers have outperformed GNC Holdings based on PE and PBV ratios. But GNC has mostly outperformed its peers based on PS ratios.
Nov. 2 2016, Updated 1:04 p.m. ET

GNC Holdings and its peers
We’ve looked at GNC Holdings’ (GNC) 3Q16 results in this series. Now let’s compare GNC with its peers as of October 28, 2016.
First, let’s compare PE (price-to-earnings) ratios:
Now let’s look at their PBV (price-to-book value) ratios:
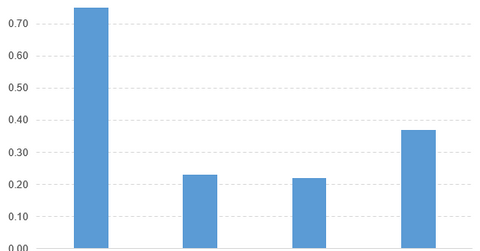
Finally, let’s compare PS (price-to-sales) ratios:
- GNC Holdings (GNC): 0.37x
- Walgreens Boots Alliance (WBA): 0.75x
- Rite Aid (RAD): 0.22x
- Staples (SPLS): 0.23x
As you can see, GNC’s peers have outperformed GNC Holdings based on PE and PBV ratios. But GNC has mostly outperformed its peers based on PS ratios.
ETFs that invest in GNC Holdings
The iShares Morningstar Small-Cap Value (JKL) invests 0.35% of its holdings in GNC. The ETF tracks a market-cap-weighted index of US small-cap value stocks. The index’s stocks are from the 90th to 97th percentile of the market-cap spectrum, using fundamental factors.
The SPDR S&P Retail ETF (XRT) invests 1.2% of its holdings in GNC. The ETF tracks a broad-based, equal-weighted index of stocks in the US retail industry.
The First Trust Mid Cap Core AlphaDex ETF (FNX) invests 0.17% of its holdings in GNC. The ETF seeks to outperform the US mid-cap sector by choosing stocks from the S&P MidCap 400 Index based on fundamental growth and value factors.
Comparing GNC Holdings and its ETFs
Let’s compare GNC with the ETFs that invest in it:
- The year-to-date price movements of GNC, JKL, XRT, and FNX are -55.5%, 11.3%, -1.6%, and 5.6%, respectively.
- The PBV (price-to-book-value) ratios of GNC, JKL, XRT, and FNX are 2.8x, 1.5x, 3.1x, and 2.1x, respectively.
According to the above findings, these ETFs have outperformed GNC Holdings based on price movement. However, GNC Holdings has mostly outperformed its ETFs based on PBV ratio.
