Why Did the Crude Oil Volatility Index Test a Record High?
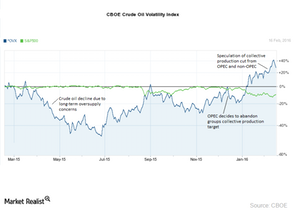
The Crude Oil Volatility Index rose to the highest level in seven years on February 12, 2016. Crude oil’s price volatility started to dip in early December 2015.
Nov. 20 2020, Updated 1:02 p.m. ET

Crude Oil Volatility Index 
The Crude Oil Volatility Index tracks the performance of the value of the volatility, also called “implied volatility,” for a basket of put and calls options. It’s also known as the “CBOE Crude Oil Volatility Index” (OVX). It measures the performance of the 30-day volatility of the United States Oil Fund (USO) ETF. USO tracks the performance of front month WTI (West Texas Intermediate) crude oil futures contracts trading in the NYMEX. Crude oil volatility increased in 2016 as shown in the following chart. The rise in volatility impacts oil producers like Petroleo Brasileiro (PBR), Statoil ASA (STO), CONSOL Energy (CNX), and ExxonMobil (XOM).
Why did crude oil volatility rise in 2016? 
OVX rose to the highest level in seven years on Friday, February 12, 2016. Crude oil’s price volatility started to dip from early December 2015 due to OPEC (Organization of the Petroleum Exporting Countries) abandoning the collective production cut at the meeting on December 4, 2015. However, the beginning of 2016 saw crude oil volatility rise due to the speculation of a collective production cut from OPEC. Read more about this deal in the first two parts of the series. Changes in the US interest rate, the slowing Chinese economy, currency wars, commodity oversupply, and oil oversupply have been also key trigger points for historic crude oil volatility.
The trading volume for US WTI (West Texas Intermediate) crude oil futures trading in NYMEX rose to 1.79 million contracts on February 11, 2016. The lowest crude oil prices in the last 12 years also contributed to the record volume. Crude oil prices are trading below the key moving averages. The 50-day moving average for US crude oil prices is at $33.60 per barrel. The 100-day moving average is at $39.14 per barrel. The 200-day moving average is $45.69 per barrel. Read more about the price forecast in the next part of the series. Oil prices need to trade above the key moving averages to gain momentum and high volume.
ETFs like the United States Oil Fund (USO), the PowerShares DB Oil Fund (DBO), and the iPath S&P GSCI Crude Oil Total Return ETN (OIL) are also influenced by volatile oil prices.
