Analyzing Lowe’s YTD Sales Performance in Fiscal 2016
Lowe’s sales performance and growth in fiscal 2016 have been robust so far, with net sales rising by 4.9% and same-store sales rising by 4.6%.
Nov. 22 2019, Updated 7:06 a.m. ET

Lowe’s fiscal 2016 recap
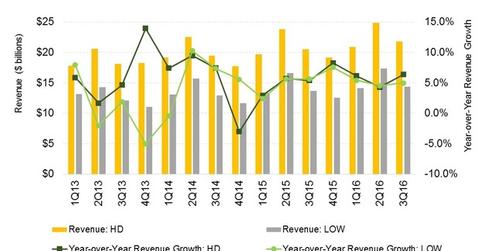
Lowe’s Companies’ (LOW) sales performance and growth in fiscal 2016 (fiscal year ending January 29, 2016) have been robust so far. In the first nine months of fiscal 2016, Lowe’s net sales rose by 4.9%, with same-store sales (VCR) (XRT) rising by 4.6%. Both average ticket size (2.8% increase) and comparable transactions (1.8% increase) were up, spurring a rise in comparable store sales, or comps. by comparison, Lowe’s had reported sales growth of 4.6%, with comps sales rising by 3.5% in the first nine months of fiscal 2015.
Why did sales grow?
Lowe’s reported positive comps in all 14 regions, in all three fiscal quarters (so far) of fiscal 2016, and in most product categories. The improvement in the housing market and higher home prices coupled with low interest rates have fueled the overall home improvement and furnishings industry. Lowe’s sales have also benefited from its initiatives to attract pros, which tend to frequent stores more and have higher ticket sizes.
Lowe’s sales performance has also been boosted by higher growth in big-ticket transactions, or tickets over $500. The increase has been driven largely by appliance and seasonal living products sales. Notably, home appliance maker Whirlpool (WHR), a Lowe’s supplier, reported sales growth of 5.1% in 2015.
Peer group comparisons and earnings drivers
So far in this earnings season, other firms operating in the industry have reported mixed performances. Home Depot (HD) grew sales by 5.5% in the comparable period while Bed Bath & Beyond (BBBY) grew its top line by 1.7%. Furniture and furnishings e-retailer Wayfair (W) has reported sales growth of over 65%, partly due to the smaller sales base.
Now let’s look more closely at Lowe’s sales expectations for fiscal 4Q16.
