Cash Flow Analysis for Renewable Energy Companies
The cash flow is an important part of a company’s financials. Lower cash flows increase a company’s chances of being caught in a vicious cycle of debt raising and refinancing.
Dec. 16 2015, Published 8:01 a.m. ET

Cash generated versus cash required
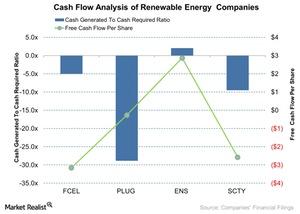
In fiscal 3Q15, renewable energy companies generated less cash than they required. For example, fuel cell companies’ average ratio of cash generated versus the cash they required was -10x in fiscal 3Q15. Meanwhile, the ratio of cash that EnerSys (ENS) generated versus the cash it required was 2x in fiscal 3Q15.
Among specific companies, FuelCell Energy (FCEL) and Plug Power (PLUG) had ratios at -5x and -28x, respectively. SolarCity (SCTY) kept its ratio at around -9.5x. A negative ratio is due to the negative cash flow.
The cash flow is an important part of a company’s financials. Lower cash flows increase a company’s chances of being caught in a vicious cycle of debt raising and refinancing. A negative cash flow indicates higher borrowing for R&D (research and development) activities.
Free cash flow per share
The FCF (free cash flow) is the residue left after the total capital expenditures from operating cash flows are spent. FCF is used to measure a degree of shareholder value.
In fiscal 3Q15, the FCF per share for EnerSys was $2.86. FuelCell Energy, Plug Power, and SolarCity had a negative FCF per share of $3.15, $0.26, and $2.57, respectively.
The above graph shows the cash generated to cash required for renewable energy companies in fiscal 3Q15. It also shows the companies’ FCF per share.
The Guggenheim Solar ETF (TAN) and the VanEck Vectors Global Alternate Energy ETF (GEX) have an average price-to-cash flow ratio of 2.57x and 5.07x, respectively. The PowerShares WilderHill Clean Energy ETF’s (PBW) average price-to-cash flow ratio is 6.96x. A lower ratio indicates relatively high cash flows.
