Neogen’s Revenue and Income Rose in Fiscal 2Q16
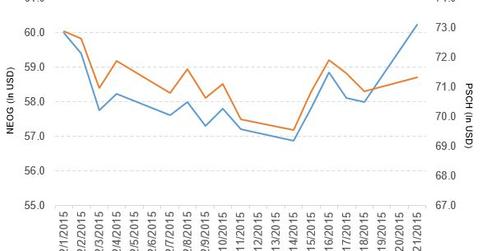
After Neogen’s (NEOG) fiscal 2Q16 earnings report, NEOG rose by 3.9% to close at $60.24 per share in yesterday’s trade.
Dec. 4 2020, Updated 10:53 a.m. ET

Neogen’s price movement
Neogen Corporation (NEOG) has a market cap of $2.3 billion. After the company’s fiscal 2Q16 earnings report, NEOG rose by 3.9% to close at $60.24 per share in yesterday’s trade. NEOG’s price movements on weekly, monthly, and YTD bases are 5.9%, 6.3%, and 21.5%, respectively.
At times, the stock has broken the support of all moving day averages in 2015. Currently, NEOG is trading 3.5% above its 20-day moving average, 9.9% above its 50-day moving average, and 19.0% above its 200-day moving average.
The PowerShares S&P SmallCap Health Care Portfolio (PSCH) invests 2.6% of its holdings in Neogen. The ETF tracks a market cap–weighted index of small-cap healthcare companies taken from the S&P SmallCap 600 Capped Health Care Index. The YTD price movement of PSCH is 18.6%, as of December 18, 2015.
Neogen’s (NEOG) competitors and their market caps are listed below:
Neogen’s performance in fiscal 2Q16
Neogen (NEOG) reported fiscal 2Q16 total revenue of $79.6 million, a rise of 16.2% when compared to its total revenue of $68.5 million in fiscal 2Q15. The revenue from the company’s food safety and animal safety segments rose by 13.0% and 19.4% respectively, in fiscal 2Q16, as compared to revenue in fiscal 2Q15.
The company’s cost of sales as a percentage of revenue and operating income rose by 4% and 13.2%, respectively, in fiscal 2Q16, as compared to fiscal 2Q15. Its net income and EPS (earnings per share) rose to $9.1 million and $0.24, respectively, in fiscal 2Q16, as compared to net income and EPS of $7.8 million and $0.21, respectively, in fiscal 2Q15.
Meanwhile, the company’s cash and cash equivalents and inventory rose by 10.8% and 9.6%, respectively, in fiscal 2Q16 on a quarter-over-quarter basis. The company’s current ratio fell to 8.0 in fiscal 2Q16, as compared to its current ratio of 8.8 in fiscal 1Q16.
CEO’s comments
According to James Herbert, Neogen’s chairman and CEO, “We recorded organic increases in revenues in many of our product lines, including animal genomics, pharmaceuticals, biosecurity products, and food safety diagnostics.” He went on to add, “Currency fluctuations continued to negatively impact both our top and bottom lines, and resulted in an adverse currency effect of about $0.02 per share to earnings or the second quarter, very similar to our first quarter. These impacts were felt in conversions to the US dollar from the euro, the British pound, the Brazilian real, and the Mexican peso.”
