How Has Lear Performed Compared to Its Peers?
Competitors have outperformed Lear based on PE and PS. However, Lear is way ahead of its peers based on PBV. Lear is way ahead of its ETFs based on price movement.
Dec. 4 2020, Updated 10:42 a.m. ET

Lear and its peers
In this part of the series, we’ll compare Lear (LEA) with its peers.
- The PE (price-to-earnings) ratios of Lear (LEA), Johnson Controls (JCI), Delphi Automotive (DLPH), BorgWarner (BWA), and Visteon (VC) are 13.22x, 17.11x, 19.46x, 15.71x, and 73.17x, respectively.
- The PBV (price-to-book value) ratios of Lear, Johnson Controls, Delphi Automotive, BorgWarner, and Visteon are 3.23x, 2.77x, 9.83x, 2.67x, and 1.75x, respectively.
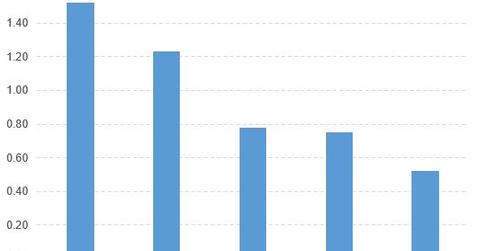
- The PS (price-to-sales) ratios of Lear, Johnson Controls, Delphi Automotive, BorgWarner, and Visteon are 0.52x, 0.75x, 1.52x, 1.23x, and 0.78x, respectively.
According to the above figures, the competitors have outperformed Lear based on PE and PS. However, Lear is way ahead of its peers based on PBV.
ETFs that invest in Lear
The First Trust Consumer Discretionary AlphaDEX ETF (FXD) invests 1.2% of its holdings in Lear. The ETF tracks an index of large and mid-cap US consumer discretionary stocks. The underlying index uses a multi-factor selection and tiered equal weighting.
The SPDR MFS Systematic Growth Equity ETF (SYG) invests 0.86% of its holdings in Lear. The ETF holds large-cap US stocks that the manager (Massachusetts Financial Services) believes have high growth potential, based on the fundamental and quantitative analysis.
The iShares Morningstar Mid-Cap ETF (JKG) invests 0.58% of its holdings in Lear. The ETF tracks a market-cap-weighted index of US mid-cap firms that exhibit both growth and value characteristics determined by a multi-factor selection.
How Lear compares to its ETFs
Now let’s compare Lear with the ETFs that invest in it.
- The year-to-date price movements of Lear, FXD, SYG, and JKG are 24.2%, -0.16%, 5.7%, and -0.11%, respectively.
- The PE (price-to-earnings) ratios of Lear, FXD, SYG, and JKG are 13.22x, 16.06x, 16.17x, and 26.59x, respectively.
- The PBV (price-to-book value) ratios of Lear, FXD, SYG, and JKG are 3.23x, 3.69x, 4.25x, and 2.71x, respectively.
According to the above figures, ETFs have outperformed Lear based on PE and PBV. However, Lear is way ahead of its ETFs based on price movement.
