IYZ Sees -$143.8 Million in Fund Outflows in the Trailing 12 Months
The IYZ ETF generated investor returns of 4.3% in the trailing-12-month period, 5.2% in the trailing-one-month period, and 7.9% in the trailing three years.
Oct. 26 2015, Published 12:52 p.m. ET

Overview of IYZ
The iShares US Telecommunications ETF (IYZ) tracks a market-cap-weighted portfolio of US telecommunication companies. This ETF tracks the performance of 24 publicly-listed companies in the US telecom sector. The market capitalization of the ETF is $433.4 million with an expense ratio of 0.45%. Its average daily volume of shares traded is $8.8 million. The price-to-earnings ratio of the IYZ ETF is 58.48x, whereas its price-to-book value ratio and distribution yield stand at 1.91x and 2.4%, respectively.
Top holdings
The top five holdings of the ETF include AT&T (T) at 11.5%, Verizon (VZ) at 10.8%, SBA Communications at 5.6%, T-Mobile (TMUS) at 5.9%, and Century Link (CTL) at 5.7%. The five holdings comprise over 40% of the total portfolio. AT&T comprises 1.2% of the SPDR S&P 500 ETF (SPY) as well.
Fund flows in the IYZ ETF
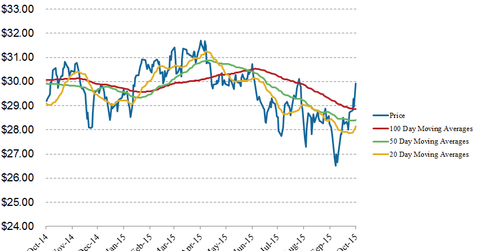
In the trailing-one-month period, net fund outflows for the iShares US Telecommunications ETF (IYZ) were -$23.9 million, whereas, in the trailing-twelve-month period, net fund outflows stood at -$143.8 million. Fund flows in the trailing-three-month (or quarterly) period for the IYZ ETF were -$53.8 million. Since May 6, 2015, the ETF was trading consistently below its moving averages, and since then fund outflows in the ETF were -$255.2 million.
The IYZ ETF generated investor returns of 4.3% in the trailing-12-month period, and 5.2% in the trailing-one-month period. In comparison, it generated 7.9% returns in the trailing-three-year period, 2.9% YTD (year-to -date) and 4.2% in the last three months. We can see that fund flows are directly related to ETF returns.
Moving averages
On October 23, 2015, the IYZ ETF closed the trading day at $29.9. Based on this figure, here’s how the stock fares in terms of its moving averages:
- 3.8% above its 100-day moving average of $28.9
- 5.4% above its 50-day moving average of $28.4
- 6.3% above its 20-day moving average of $28.2
Relative strength index
The IYZ ETF’s 14-day RSI (relative strength index) is 66.5, showing that the ETF is slightly overbought[1. Generally, if the RSI is above 70, it indicates the stock is overbought. An RSI figure below 30 suggests that a stock has been oversold.].
