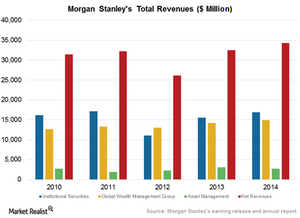
Morgan Stanley’s Strong Revenue Model
Morgan Stanley charges fixed fees and performance fees for asset management services, products and services, and administration of accounts.
Dec. 4 2020, Updated 10:53 a.m. ET

Morgan Stanley’s revenue model
Morgan Stanely (MS) engages in investment management, wealth management, institutional sales, and trading activities across asset classes as well as regions. In its Investment Banking and Capital Markets division, the company charges a major portion of its total fees from various clients on successful completion of transactions, such as:
- mergers and acquisitions
- fund-raising activity
- joint ventures
- restructuring
- public offerings
In its sales and trading activities, Morgan Stanley charges markups, brokerage, commissions, or fixed fees on the basis of the total quantum of offerings sold. Its Wealth Management division has transaction-based pricing as well as fee-based pricing.
Asset management and fees
Morgan Stanley charges fixed fees and performance fees for its asset management services, its distribution of products and services, and its administration of accounts or technology-based services. The company charges performance fees on certain private equities, shareholder servicing, separately managed accounts, and open-ended mutual fund distribution.
Interest income
Morgan Stanley is also involved in commercial banking activities through its subsidiary Morgan Stanley Private Bank, NA (National Association), or MSBNA. The company records interest income and expenses, which are based on the quantum of loans and deposits, commercial paper, and other loans and advances. The bank is also dependent upon a mix of the following in the company’s prime brokerage business:
- trading assets and trading liabilities
- investment securities
- total assets and liabilities
- borrowed or loaned securities
- short-term and long-term borrowings
- trading strategies
- customer activity
Morgan Stanley’s operating margins for the past twelve months stood at 9.46%. Here’s how its peers compare:
- Goldman Sachs Group’s (GS) operating margin was 30.8%.
- JPMorgan Chase’s (JPM) operating margin was 31.9%.
- Bank of America Corporation’s (BAC) operating margin was 8.1%.
- Wells Fargo & Company’s (WFC) operating margin was 40.2%.
Together, these banks account for approximately 28% of the Financial Select Sector SPDR Fund (XLF).
For a look at Morgan Stanley’s compensation expenses, check out the next part of this series.
