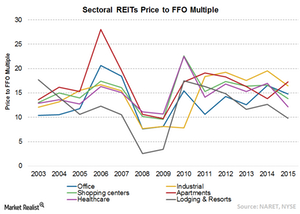
Most of the REITs Are Trading near Historic Multiples
The most common way of calculating the relative value of a REIT is the price-to-FFO multiple. FFO is widely used because it’s the main earnings metric for REITs.
Sept. 7 2015, Updated 9:05 a.m. ET

Price-to-FFO multiple
The most common way to calculate the relative value of a REIT like Simon Property Group (SPG) is the price-to-FFO (funds from operations) multiple. FFO is widely used because it’s the main earnings metric for REITs. It’s similar to the EPS (earnings per share) in other industries. Price-to-FFO is equivalent to the PE (price-to-earnings) ratio used in other industries.
During the pre-recession period, most of the sectoral REITs were traded at a price-to-FFO in the range of 12x–15.5x. The recession impacted REITs drastically as their valuation multiple was down in the range of 7x–11x. At the end of June 2015, REITs like Equity Residential (EQR) traded at a 16.7x price-to-FFO multiple. It was close to the ten-year averages of 16x.
Lodging and resort REITs like Host Hotels & Resorts (HST) trade at a lower price-to-FFO multiple than other REITs because they’re involved in a highly cyclical business with a volatile earnings stream. In contrast, a higher price-to-FFO multiple for industrial REITs compared to other REITs can be attributed to improvement in the business scenario and rising global trade. This ensures a steady earnings flow over a longer duration.
Price-to-NAV multiple
The price-to-NAV (net asset value) ratio for REITs is similar to the price-to-book value used to evaluate other companies. The price-to-NAV ratio is an estimate of the company’s forward NAV. Generally, REITs with higher NAV growth trade at premiums to their current NAV while REITs with lower NAV growth trade at a discount to their current NAVs.
As you can see in the above chart, the price-to-NAV of REITs peaked to a high of 113% in 2003 before falling to around 83% during the housing crisis. Since then, it has recovered. Now, it’s trading in the range of 93% to 104%.
Investors looking for diversification in the REIT sector can get exposure to REIT ETFs like the Vanguard REIT ETF (VNQ), the iShares U.S. Real Estate ETF (IYR), and the iShares Cohen & Steers REIT ETF (ICF).
