Newmont Reports Strong Gold Production in 2Q15
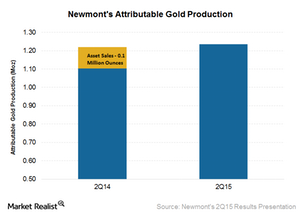
Newmont Mining’s (NEM) attributable gold production for 2Q15 was 1.24 million ounces. This is higher by 0.2 million ounces compared to the same quarter last year.
July 31 2015, Updated 3:06 p.m. ET

Higher gold production
Newmont Mining’s (NEM) attributable gold production for 2Q15 was 1.24 million ounces. This is higher by 0.2 million ounces compared to the same quarter last year. This is despite Newmont’s divestment of Jundee and La Herradura mines during the period. Indonesia’s Batu Hijau and Tanami mines helped more than offset the fall in Newmont’s production due to these divestments.
Below is Newmont’s geographical production profile.
- North America – Production for Newmont’s North America segment fell 6% year-over-year in 2Q15, mainly due to the sale of the La Herradura mine in October 2014.
- Asia Pacific – Attributable production from Newmont’s Asia Pacific segment increased 12.6% year-over-year in 2Q15. This is mainly due to increased mill utilization and higher grade from the Boddington and Tanami mines in Australia.
- Africa – Production from the African region fell 18% year-over-year. The power shortage in Ghana led to load shedding, which was the main reason for lower production. Lower ore grade also led to decreased production.
Copper production climbs
Attributable copper production also increased to 41,000 in 2Q15 compared to 20,000 tons in 2Q14. However, investors need to note that the same quarter last year was impacted by a temporary export ban from Indonesia.
Higher grades were mined at Batu Hijau, as production reached the higher grade Phase 6. Batu Hijau also operated and shipped at full capacity, which not only led to an increase in production but also helped lower overall costs.
While Newmont has been reporting strong production, that’s not the case with its peers. Barrick Gold’s (ABX) gold production in 1Q15 finished 12% lower year-over-year at 1.39 million ounces. Goldcorp (GG) also reported slightly weaker-than-expected production due to ramp-up delays at two of its mines in 1Q15.
Barrick Gold and Goldcorp form 5.5% and 7.2%, respectively, of the VanEck Vectors Gold Miners ETF (GDX). The SPDR Gold Shares (GLD) is a good way to gain exposure to spot physical gold prices.
