Key Indicators Freeport Investors Should Track
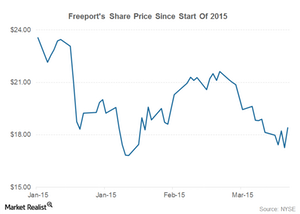
Freeport has lost almost 20% of its market capitalization so far this year, making 2015 a turbulent period for the company.
March 30 2015, Published 12:40 p.m. ET

Key industry indicators
Freeport-McMoRan (FCX) is a leading natural resources company and ranks among the world’s top copper producers. Freeport is the largest molybdenum producer and has interests in gold mining. Over the years, Freeport has also diversified into energy production, holding a significant portfolio of oil and natural gas assets.
What do we cover?
In our recent series on Freeport-McMoRan, we covered the complete business overview of Freeport and compared it with other copper producers like Teck Resources (TCK), Southern Copper (SCCO), and Glencore (GLNCY). In this series, we will discuss the key indicators that Freeport investors should track.
Freeport has lost almost 20% of its market capitalization so far this year, making 2015 a turbulent period for the company. This can be seen in the above chart. Freeport currently forms 3.41% of the iShares US Basic Materials ETF (IYM) and 3.25% of the SPDR S&P Metals and Mining ETF (XME).
Copper
Freeport is directly impacted by the dynamics of the copper industry. Copper is one of the earliest metals to be discovered by mankind and is the third most widely used metal in the world. China is the world’s largest copper consumer, accounting for 42% of global copper consumption. The United States is the second biggest copper consumer, followed by Germany. Chinese copper demand is a key driver for the copper industry. We will discuss the recent trends in the Chinese copper industry later in this series.
Home appliances, construction, and the power sector are among the major end consumers of copper. Investors should analyze the indicators of these industries to understand how copper demand is shaping up.
In the following article, we’ll discuss several other indicators that Freeport investors should track.
