Analyzing the Prospects of Nike’s Geographic Segments
Most of Nike’s (NKE) incremental revenue was recorded in its North America market, Nike’s largest geographical segment.
May 3 2021, Updated 10:45 a.m. ET
Nike in North America
Most of Nike’s (NKE) incremental revenue was recorded in its North America market, Nike’s largest geographical segment. Nike derived ~44% of its revenue from North America in 1H15. In contrast, peers Lululemon Athletica (LULU) and Under Armour (UA) derive over 90% of their revenues from the North American market.
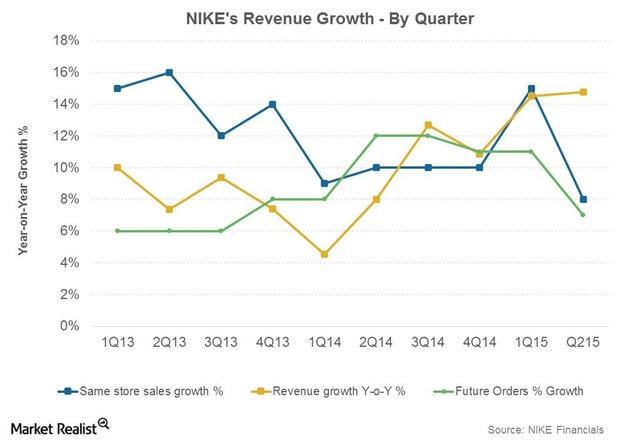
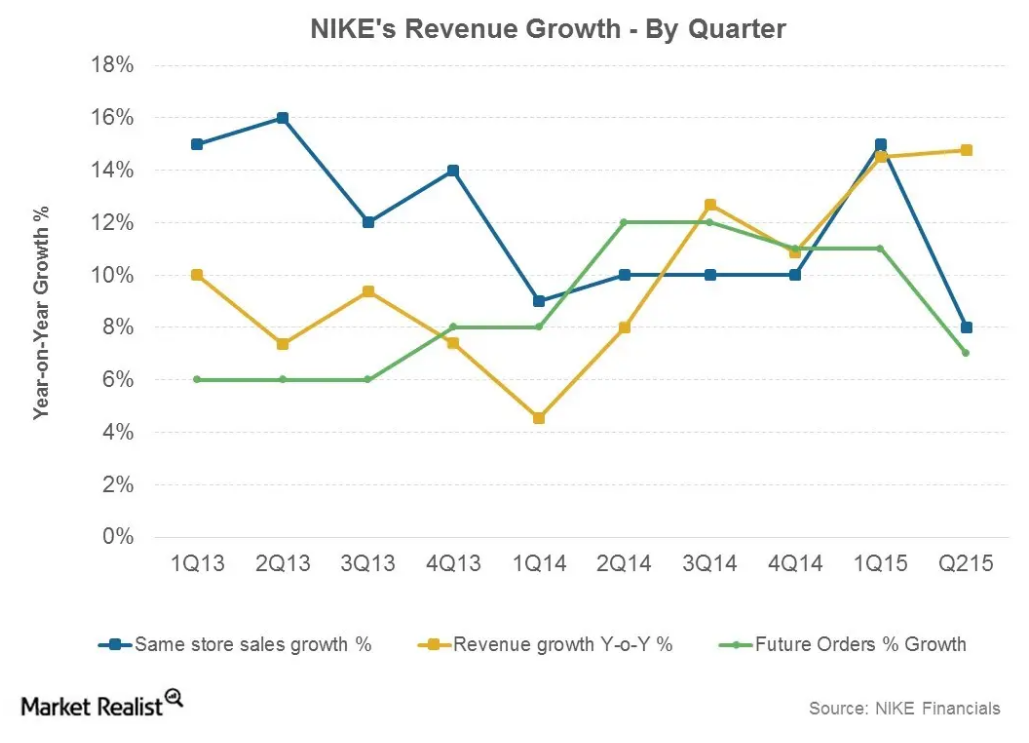
Nike’s reported North American revenue grew 13.8% year-over-year to $6.8 billion. Revenue gains were a result of retail expansion in the company’s direct-to-consumer (or DTC) channel, 10% store comps growth in 1H15, and higher e-commerce sales. Nike’s market share also expanded in key product categories.[3. up to September 27, 2014 (SportsOneSource)]
Overseas markets
Nike’s performance outside North America in 1H15 was mixed. Revenue showed above-average growth in Western Europe and Greater China—both key markets for Nike. Western Europe and Greater China contributed 4% and 2%, respectively, to the overall growth in revenue.
Western Europe is Nike’s second-largest segment, accounting for 19.7% of revenue. Reported revenue grew at 27.4% year-over-year to $3.0 billion in 1H15. Nike has been expanding its retail footprint rapidly in Western Europe. Growth in Western Europe was spurred by higher DTC sales, which grew 40% year-over-year. Nike also recorded comps store growth of 17% and higher e-commerce sales.
China is another key market for Nike. Greater China revenues grew 19.4% year-over-year to $1.4 billion in 1H15. DTC growth was strong, with comp sales growing at 28% in 1H15 and higher e-commerce sales. But all was not sunshine in China. The company experienced declines in men’s training, action sports, and soccer.
Despite the relatively healthy growth shown by the world’s #1 sports gear company in overseas markets, macro fundamentals are undergoing a change. We’ll discuss these changes in parts 8 to 10 of this series.
Nike (NKE) is part of the select 30-stock Dow Jones Industrial Average and the broader market–tracking S&P 500 Index. ETFs like the SPDR Dow Jones Industrial Average ETF (DIA), the SPDR S&P 500 ETF (SPY), and the SPDR Consumer Discretionary Select Sector ETF (XLY) provide exposure to Nike (NKE). DIA, SPY, and XLY invest 3.5%, 0.4%, and 2.9% of their portfolio holdings in Nike (NKE).