Job Creation Isn’t Matching Population Growth
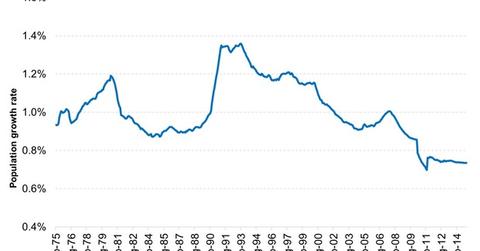
Job creation isn’t matching population growth. The population growth has been dipping over the last two decades. Currently, it’s 0.7% per year.
Feb. 16 2015, Updated 1:06 p.m. ET

The decline in the participation rate has coincided with the longer-term deceleration in US growth. Back in the late 1990s, when the participation rate was at its peak, the economy was growing more than twice as fast as recent levels. Between 1996 and 2000, real US gross domestic product growth averaged 4.3%. Since then, GDP growth has averaged a relatively limp 1.8%, with growth never topping 3.5% for any given year. While there are a number of factors that help explain the declining growth rate – including slower productivity growth, slower population growth and the aftermath of the financial crisis – fewer people working is arguably contributing to the slowdown.
Market Realist – Job creation isn’t matching population growth.
The graph above shows the annual population growth rate in the US. The population growth has been dipping over the last two decades. Currently, it’s 0.7% per year.
In contrast, non-farm payrolls have been increasing every month since late 2010. However, in the long term, they haven’t kept up with the increase in population—mainly due to the severe layoffs during the Great Recession.
Every month, many individuals are entering the legal age to work. As a result, job creation isn’t matching population growth. Also, the labor force participation rate is the population between the age of 15 and 64. Since many of these people remain out of the labor force, the labor force participation rate is low. Today, this is the case in most developed markets (EFA).
Since November 2004, the US population increased by a little more than 25 million people. During the same period, only about 7.2 million non-farm jobs were created. Since non-farm payrolls account for roughly 80% of all US jobs, we can assume that ~9 million non-farm jobs were created during the period. This leaves a deficit of 16 million. At the current metrics, that implies an 8% unemployment rate. It could be misleading to mix cumulative figures from different periods.
There’s another approach to understanding the impact of the participation rate on the unemployment rate. You multiply the current 320 million people in the US, by the 62.9% participation rate by the latest unemployment rate of 5.7%. This determines that there are ~11.5 million unemployed people. If we change the participation rate back to a pre-crisis level of ~66%, those 11.5 million unemployed people would imply an unemployment rate close to 6%.
Assuming constant returns to scale in gross domestic product, or GDP, growth—GDP growth increases linearly with labor growth—this means that the participation rate is causing a drag of 0.3% on GDP growth. Fewer people in the workforce are a major drag for the economy. This negatively affects the stock markets (SPY)(IVV). It’s positive for safe-haven assets like US Treasuries (TLT)(IEF).
