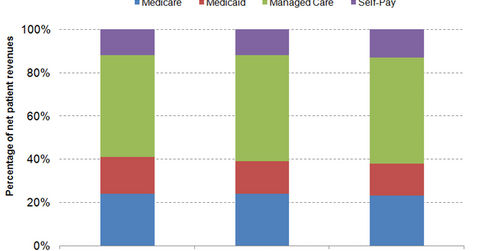
Universal Health Services’ payer mix differs from other companies’
Universal Health Services (UHS) has displayed a trend in payer mix from 2011 to 2013 that differs from other companies in the healthcare industry (XLV).
Jan. 5 2015, Updated 1:15 p.m. ET

Payer Mix
Universal Health Services (UHS) has displayed a trend in payer mix from 2011 to 2013 that differs from other companies in the healthcare industry (XLV).
The above graph shows the breakdown of Universal Health Services’ revenues by payer. For more information on hospital payers, please see Who pays hospital bills? Analyzing hospitals’ payer mix. The share of Medicare and Medicaid revenues declined from 2011 to 2013, while the share of managed care or commercial insurer and self-pay revenues increased in the same period. With an increase in the level of the insured population on account of Medicaid expansion and health insurance marketplaces, other for-profit hospital operators—such as HCA Holdings (HCA), Community Health Systems (CYH), and LifePoint Hospitals (LPNT)—recorded a decline in self-pay revenues as a percentage of total revenues from 2011 to 2013.
Acute care services
Universal Health Services’ payer mix is different that that of its competitors due to the company’s unique service mix, consisting of acute care services and behavioral health services.
The acute care services segment displays a payer mix resembling other for-profit hospital players. The above graph shows that Medicaid revenues increased from 7% of total revenues in 2012 to 8% in 2013, while self-pay revenues decreased from 7% to 6% in the same period, reflecting the increase in patient admissions with insurance coverage.
Behavioral health
According to a report by Mental Health America, though the Affordable Care Act (or ACA) increased the percentage of insured Americans, about 8.1 million people with mental illness remained uninsured in 2012.
With key markets of Nevada, California, and Texas among the states with the most uninsured mental health patients, Universal Health Services’ self-pay revenues as a percentage of total revenues rose from 18% in 2012 to 19% in 2013.
