Shareholder Returns Analysis: Where VF Corp. Trumps Competitors
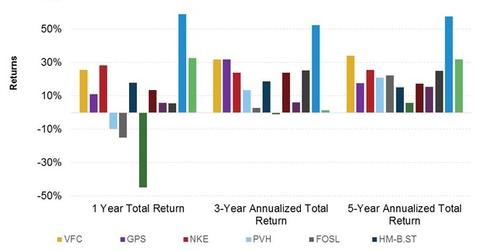
VFC’s total annualized returns to shareholders appear among the most consistent within its peer group for one-year, three-year, and five-year time periods.
Feb. 13 2015, Updated 5:05 p.m. ET

Earnings growth
Despite margins that could possibly have room for improvement, VF Corporation’s (VFC) historical performance for shareholders has been consistent. Profits have shown healthy growth. The company’s EBITDA (earnings before interest, taxes, depreciation, and amortization) and operating income grew at a CAGR (compounded annual growth rate) of 9.7% and 10.4%, respectively, over the past ten years. EBITDA and operating income for 2013 came in at $1.9 billion and $1.6 billion, respectively.
That’s slightly ahead of growth rates exhibited by NIKE (NKE) and Hennes & Mauritz (HM-B.ST) over the same period. But growth has been lower than Inditex’s (ITX.MC), Under Armour’s (UA), and Lululemon Athletica’s (LULU). These companies have some of the highest growth rates among their peers.
An important consideration is that VFC’s growth has been organic as well as inorganic, while the other companies have grown through expansions of their existing businesses. Also, UA and LULU are new and have smaller bases, which has pushed their growth rates upward.
Stock price
VFC’s stock price has appreciated significantly over the past few years. The company’s stock is up by 423% since January 1, 2009. That compares favorably with mature companies in the space such as NIKE (NKE) and Adidas (ADDYY), which are up by 267% and 74.6%, respectively, over the same period. In comparison, the SPDR S&P 500 ETF (SPY), which tracks the S&P 500 Index, is up by 125%.
VFC’s stock price appreciation is also larger than that of the overall consumer discretionary sector in the United States. The Consumer Discretionary Select Sector SPDR ETF (XLY), which provides a good reference point for the sector, is up by 223.2% over the same period.
Shareholder returns
Let’s take three time periods, specifically one-year, three-year, and five-year. According to the above chart, VFC’s total annualized returns to shareholders appear among the most consistent within the peer group for these time periods. Other firms with consistent returns include NIKE (NKE) and Under Armour (UA). VFC posted the second-highest returns to shareholders over three-year and five-year periods within its peer group, second only to Under Armour (UA), which has beaten the peer group by a wide margin.
Under Armour (UA), the new kid on the block, has seen phenomenal growth since going public in 2006. To get a detailed overview of its business and growth prospects, read High-Performance Winner? Your Must-Know Guide To Under Armour.
