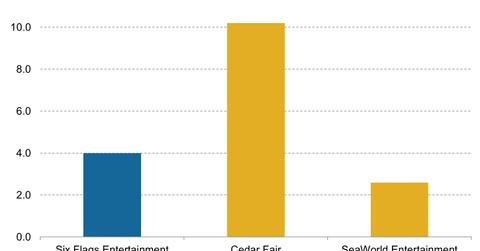
Must-know: A look into Six Flags’ debt-to-equity ratio
Industry debt-to-equity ratio is about 5.5. Six Flags’ debt-to-equity ratio of 4.0 shows the company aggressively finances operations with debt capital.
Nov. 20 2019, Updated 1:02 p.m. ET

Debt-to-equity ratio
Since the theme park industry is capital-intensive in nature, companies aggressively financing their growth with debt will have a high debt-to-equity ratio.
The above chart shows that as of September 30, 2014, Six Flags Entertainment Corp.’s (SIX) debt-to-equity ratio stood at 4.0, which is less than half of Cedar Fair’s (FUN) but a little more than SeaWorld Entertainment’s (SEAS).
The debt-to-equity ratio for the industry is around 5.5. Six Flags’ debt-to-equity ratio of 4.0 reflects that the company is quite aggressively financing its operations with debt capital. For a capital-intensive industry, a debt-to-equity ratio of 2 is generally treated as normal.
ETFs such as the Consumer Discretionary Select Sector SPDR Fund (XLY) and the iShares U.S. Consumer Services ETF (IYC) track the performance of leisure companies.
Debt financing
Debt financing is cheaper since the interest on debt is tax deductible. Six Flags could generate more earnings if a lot of debt were used to finance increased operations. This could result in earnings greater than the weighted average cost of capital (or WACC) and hence benefit the shareholders.
However, at one point, too much leverage may pose a threat to net profits on account of huge interest expenses. This may lead to bankruptcy.
Net debt-to-EBITDA
Net debt-to-EBITDA (earnings before interest, taxes, depreciation, and amortization) show a company’s capacity to pay its debt. The lower the ratio, the higher is the company’s capacity to retire its debt from its operating cash flows. EBITDA is often used as a proxy for operating cash flows.
As of September 30, 2014, Six Flags Entertainment’s net debt-to-EBITDA stood at 3.4x. This is much lower compared to SeaWorld Entertainment’s (SEAS) but slightly higher than Cedar Fair’s (FUN). This ratio is important since it shows the earnings capacity of a company to pay its debt.
In the second chart, you can see that Cedar Fair (FUN) has a better debt-paying capacity than SeaWorld Entertainment (SEAS), even though Cedar Fair (FUN) has a higher debt-to-equity ratio than SeaWorld Entertainment (SEAS) according to the first chart in this article.
