SeaWorld Entertainment Inc
Latest SeaWorld Entertainment Inc News and Updates

SeaWorld Isn't Going Out of Business — Update on Unpaid Rent Status
SeaWorld San Diego has defaulted on its deferred rent and could be facing serious repercussions for doing so. Is SeaWorld going out of business?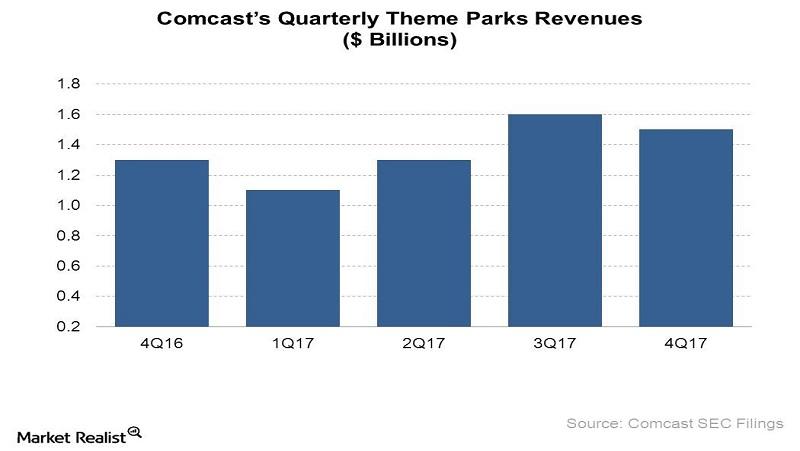
Here’s How Comcast’s Theme Park Business Performed in 4Q17
Comcast’s (CMCSA) Theme Parks business was a star performer in 4Q17, with revenue growth accelerating over the previous quarter.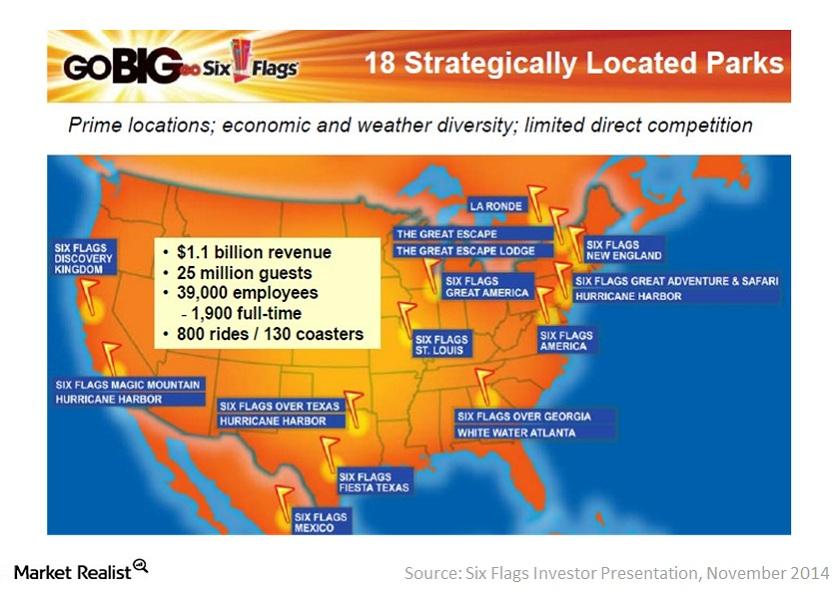
Six Flags Entertainment: An overview of the largest theme park
Six Flags Entertainment Corp. (SIX) is the world’s largest regional theme park company with $1.1 billion in revenue and 18 parks across North America.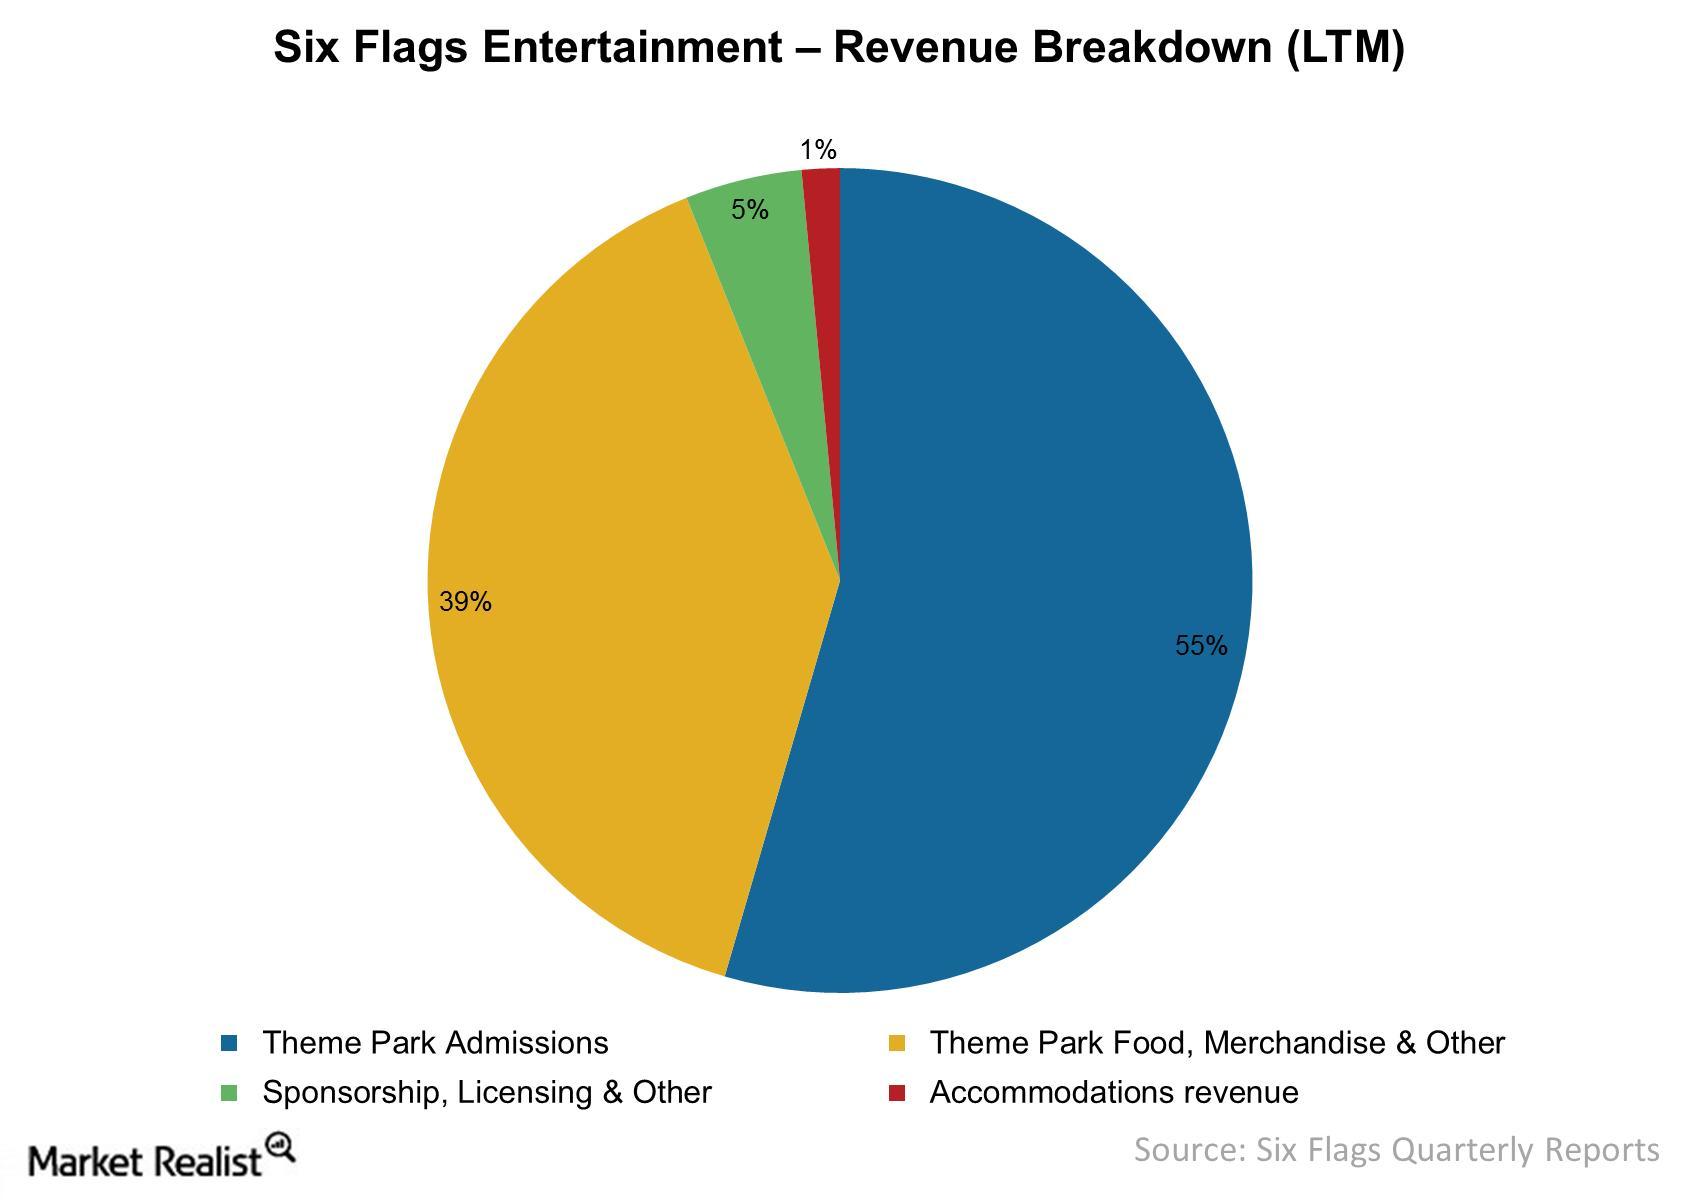
Must-know: How Six Flags generates its revenues
Six Flags derived 55% of its revenues from theme park admissions for the last 12 months ended September 30, 2014.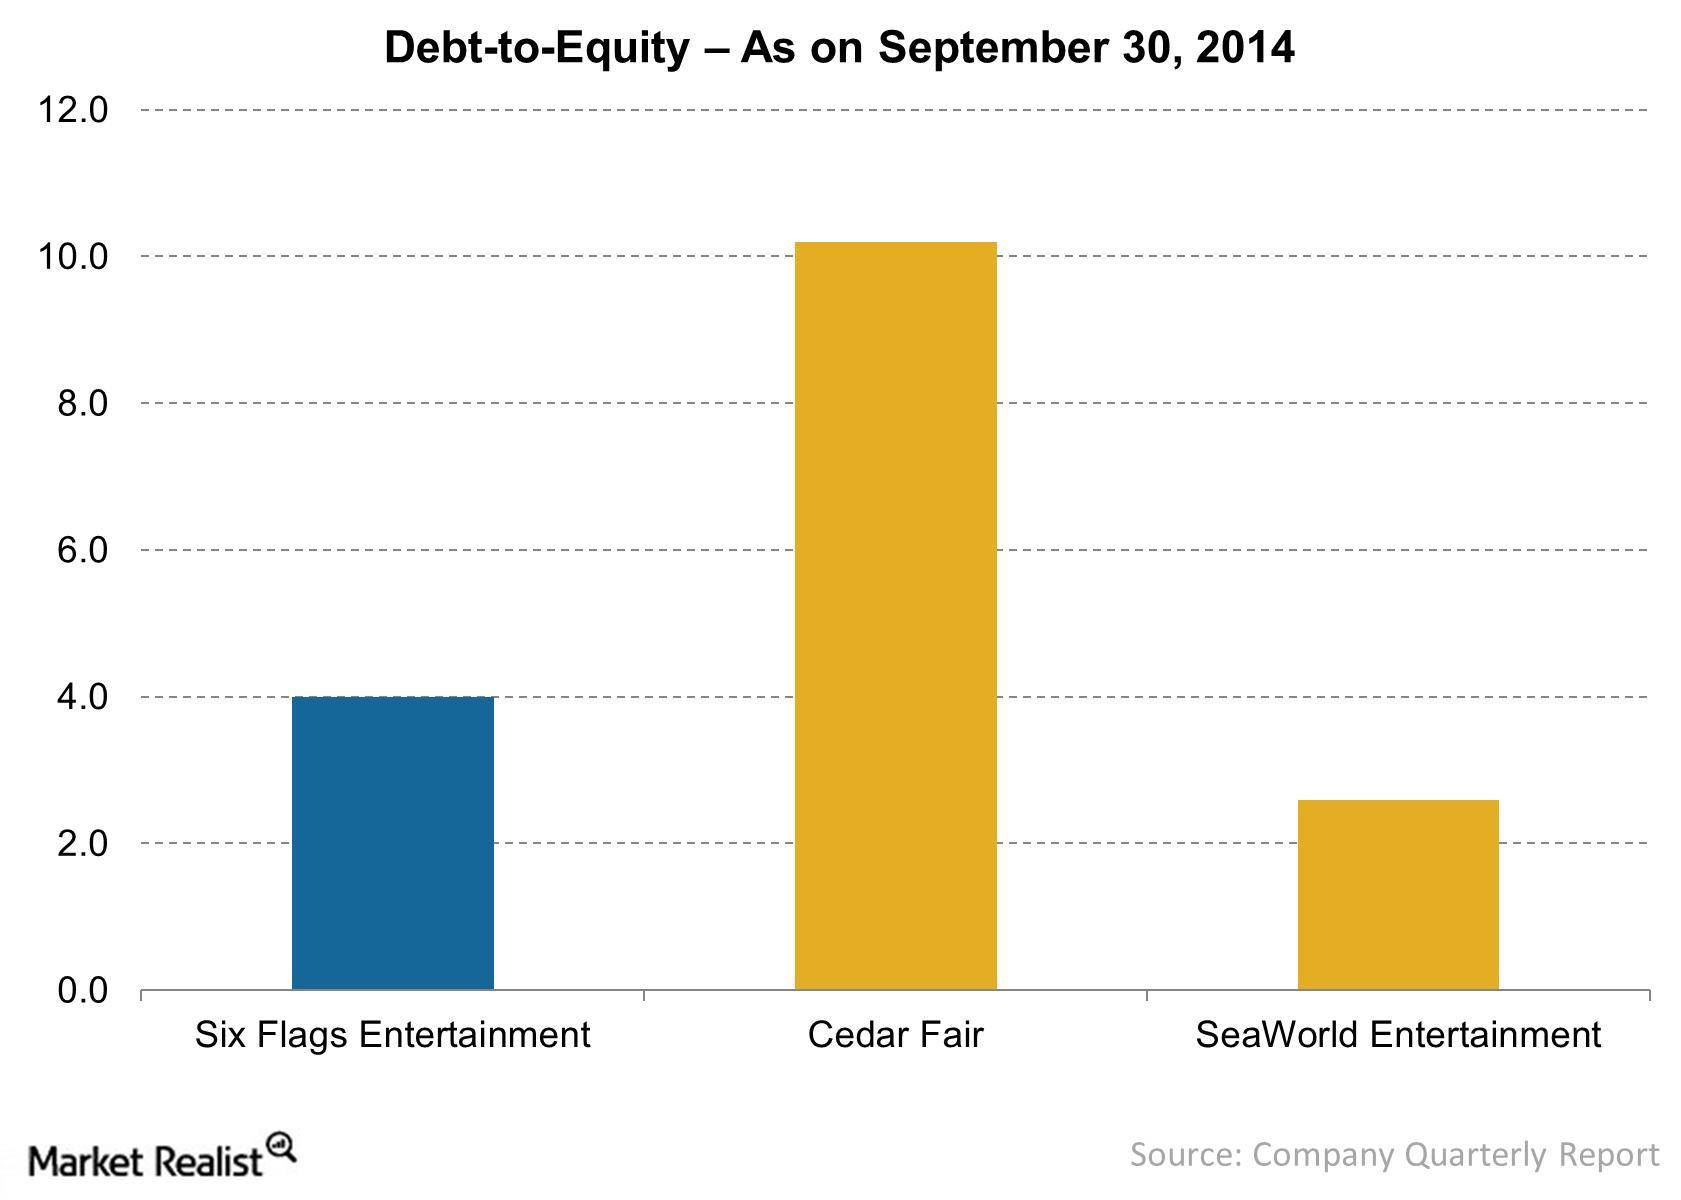
Must-know: A look into Six Flags’ debt-to-equity ratio
Industry debt-to-equity ratio is about 5.5. Six Flags’ debt-to-equity ratio of 4.0 shows the company aggressively finances operations with debt capital.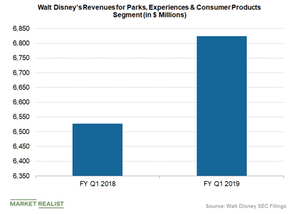
How Theme Parks Are Fueling Disney’s Revenue
Disney has been generating substantial revenues from its theme parks, which have remained the driving force of the company’s top line growth.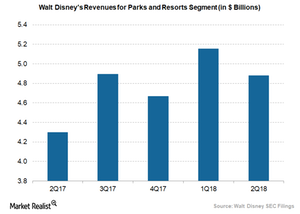
Why Disney Is Investing in Theme Parks
In fiscal 2Q18, Disney’s Parks and Resorts segment reported revenues of $4.9 billion.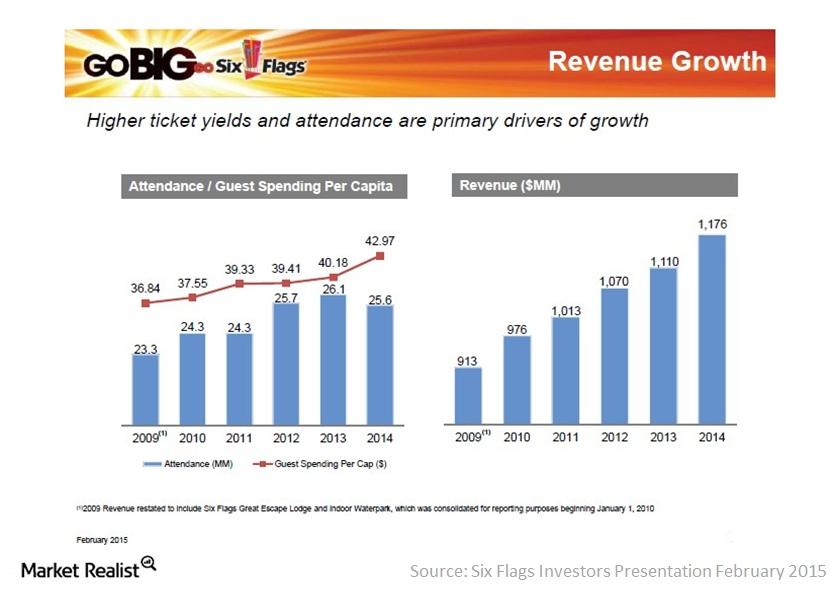
Why Six Flags’ guest spending per capita improved
Six Flags’ per capita guest spending increased $2.79, or 7%, to $42.97 in 2014, primarily due to improved admissions pricing and new offerings in the parks.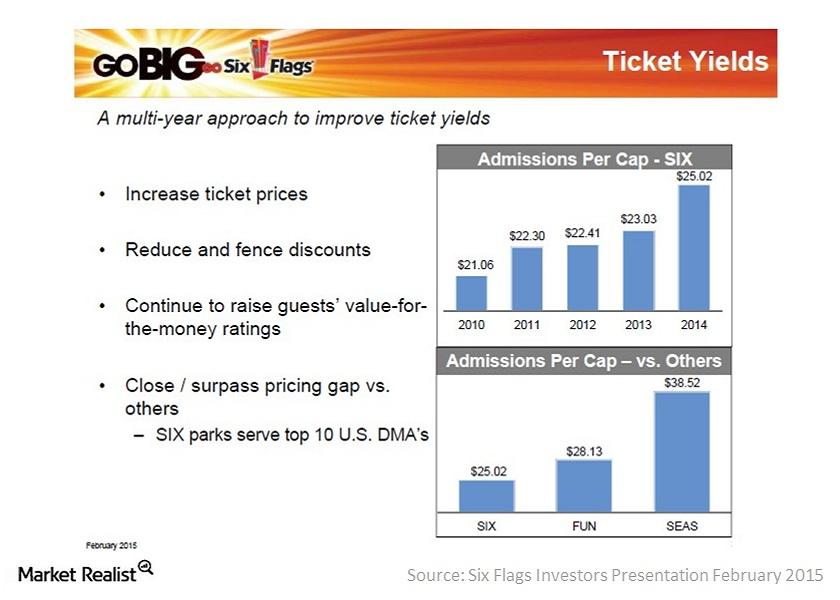
Ticket pricing pushes Six Flags’ admissions revenue up
Six Flags’ (SIX) admissions revenue per capita increased by 9% in 2014, primarily driven by pricing improvements on multi- and single-use ticket offerings.