Must-know: A glossary of technical analysis terms
In technical analysis, there’s a series of common terms. Understanding the glossary of technical analysis terms is helpful for investors. Technical analysis is used to predict stock prices. It uses price, time, and volume data.
Nov. 20 2020, Updated 11:39 a.m. ET

A glossary of technical analysis terms 
In technical analysis, there are a series of common terms. Understanding the glossary of technical analysis terms is helpful for investors. Technical analysis is used to predict stock prices. It uses price, time, and volume data.
Line chart – A single line that connects stock prices is called a line chart.
Bar charts – A chart that has open, high, low, and close data sets in a vertical line in the form of a bar. It’s also referred to as an open-high-low-close (or OHLC) chart.
Candlestick charts – A chart that has open, high, low, and close data sets in a candle form.
Support – A straight line that connects three or more of a stock’s data points. It usually indicates the stock is going down.
Resistance – A straight line that connects three or more of a stock’s data points. It usually indicates the stock is going up.
Trend – The directional movement of a stock price.
Uptrend – Stocks are in an uptrend when they’re making higher highs and higher lows.
Downtrend – Stocks are in a downtrend when they’re making lower highs and lower lows.
Sideways trend – Stocks that trade in a range are in a sideways trend.
Patterns – Price patterns are trends that occur in stock charts. The patterns form recognizable shapes.
Triangle pattern – The pattern is in the form of a triangle.
Rectangle pattern – The pattern that’s formed when stock trades sideways.
Head and shoulder pattern – A reversal pattern that has three consecutive peaks.
Double top and bottoms – Two consecutive peaks between two horizontal lines is called double top. Two consecutive bottoms between two horizontal lines is called double bottom.
Triple top and bottoms – Three consecutive peaks between two horizontal lines is called triple top. Three consecutive bottoms between two horizontal lines is called triple bottom.
Simple moving average – An average of the closing price of the stock over a specified number of periods.
Volume – The measure of the number stock’s shares traded on the stock exchange in a day or a period of time.
Relative Strength Index – The Relative Strength Index (or RSI) is a measure of the overbought and oversold position of a stock.
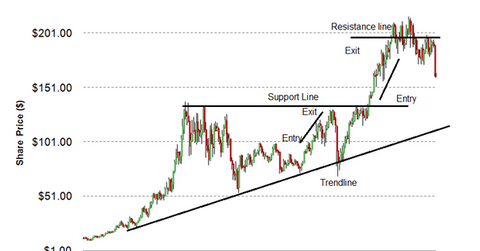
The above chart shows entry and exit for IBM’s (IBM) stock. Entry is given for stock after the resistance breakout. The target is given at the next resistance level.
Stochastic indicator – An indicator that compares the closing price of the stock with the stock price over a given time period.
Moving Average Convergence Divergence – Moving Average Convergence Divergence (or MACD) is the difference between two moving averages.
Bollinger Bands – Bollinger Bands are a channel of moving averages over the stock prices.
Applying technical analysis concepts
The technical analysis concepts can be applied to stocks like Ford Motors (F), General Motors (GM), Tesla Motors (TSLA), and Goodyear Tire (GT). These companies are all major parts of exchange-traded funds (or ETFs) like the Consumer Discretionary Select Sector SPDR Fund (XLY).
Visit the Market Realist Technical Analysis page to learn more.
