Must-know fundamentals about the US Consumer Price Index
The Bureau of Labor Statistics (or BLS) developed the U.S. CPI in 1913 to measure the change in prices.
Sept. 1 2020, Updated 10:49 a.m. ET

The Consumer Price Index
Most of us are familiar with the Consumer Price Index (or CPI). CPI certainly gets a lot of attention, as it is very important to an individual investor. The CPI is used to adjust social security payments and as the reference rate for Treasury Inflation Protection Securities (TIP) and inflation swaps. A rise in the CPI levels often compels investors to flock to TIPS and precious metals like gold (GLD) and silver (SLV).

What is the CPI?
The Bureau of Labor Statistics (or BLS) developed the U.S. CPI in 1913 to measure the change in prices. It measures the average change in prices consumers pay for a market basket of consumer goods and services over a period of time.
The CPI-U reflects spending patterns of all urban consumers, representing 87% of the total U.S. population. On the other hand, the CPI-W reflects the spending patterns of urban wage earners and clerical workers, who represent 32% of the total U.S. population.
How does the BLS calculate CPI?
The BLS collects price data from consumer expenditure surveys for a sample of goods and services representing 211 categories across 38 geographic regions. The BLS accords weights to different items based on their relative importance to the total and are re-balanced at the end of every two years.
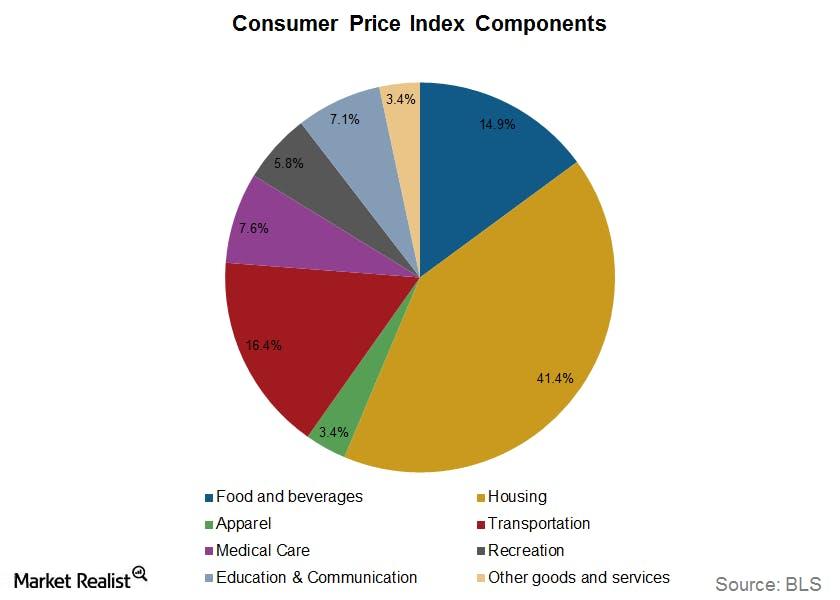
The above graph shows the weights allocated to the major eight groups as of December 2013, when they were last re-balanced. Maximum weight is allocated to housing (IYR), followed by transportation. Food and beverages, apparel, medical care (XLV), recreation, and education are some of the other categories.
Difference between Core CPI and Headline CPI
The headline index refers to the CPI, including all items in the economy. Core CPI refers to the consumer price index, excluding all food and energy-related items. Both food and energy (XLE) are highly price sensitive and change more rapidly due to macro-economic factors than the rest of the underlying index.
So, if you only look at the headline inflation figure, you could make the incorrect assumption that the general price index is changing more swiftly than it actually is. Another reason why economists prefer to use core inflation is that most of the substantial changes from food and energy items are seasonal, temporary, and reverse quickly. This eliminates the need for a change in monetary policy as a response.

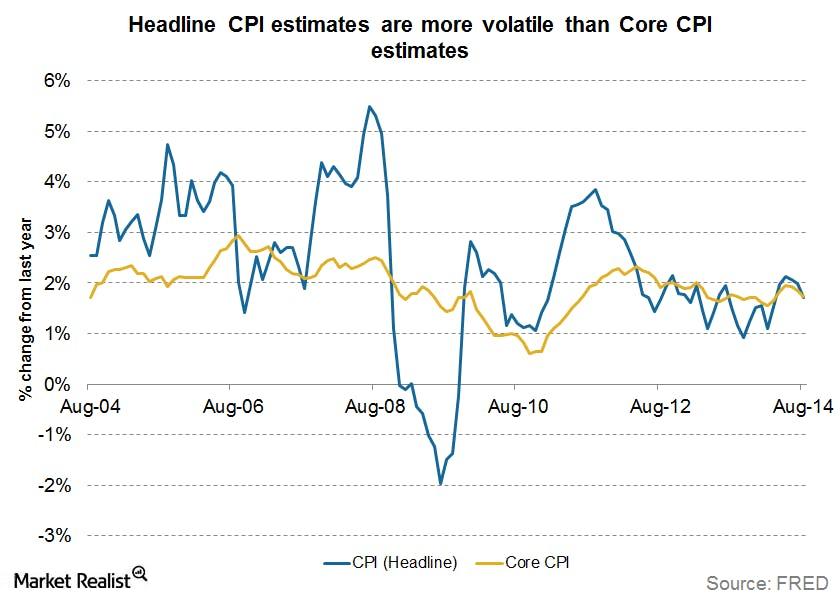
The previous graph shows the Core and headline CPI figures for the U.S. The core CPI shows more price stability than the headline figures. This is why core measures are better able to reflect long-term trends.
Read on to the next part of the series to learn about the Personal Consumption Expenditure Price Index as a measure of inflation.
