Market Realist dry bulk shipping blast (Part 5: Shipping rates)
Continued from Part 4 Supply and demand drives dry bulk shipping companies Although we must analyze demand in order to project future dry bulk shipping rates, imports data aren’t widely available on a weekly basis. But shipping rates, which reflect the difference in demand and supply, are collected on a daily basis at the London-based Baltic […]
Nov. 20 2020, Updated 4:50 p.m. ET

Continued from Part 4
Supply and demand drives dry bulk shipping companies
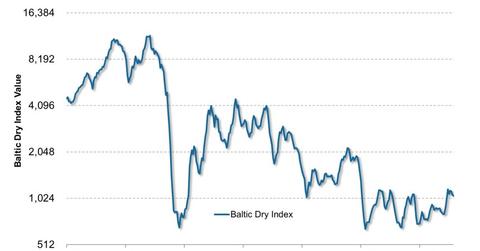
Although we must analyze demand in order to project future dry bulk shipping rates, imports data aren’t widely available on a weekly basis. But shipping rates, which reflect the difference in demand and supply, are collected on a daily basis at the London-based Baltic Exchange and published as the Baltic Dry Indexes (BDI). These indexes reflect the daily shipping rates to transport key dry bulk raw materials in the spot market. When demand outpaces supply growth, shipping rates tend to rise. But when an increase in supply doesn’t meet with demand, shipping rates fall. [1. The two main revenue generation models in the shipping industry are spot (voyage) and time (period) charters. “Spot charters” refer to the one-time price of shipping a specific amount of raw material, while “time charters” reflect the price of borrowing a ship’s service for a specific period. “Time Charter Equivalent” (TCE), which converts spot charters (specified in $ per ton) to time charter rates ($ per day), is often used to compare companies in different markets. The two often mirror each other over the medium and long terms.]
Shipment growth and lower capacity supporting higher rates
Last week, the Baltic Dry Index fell from 1,082 on July 26 to 1,065 on August 2, dragged down by declines in Panamax and Supramax vessels. But current levels still stand higher than what they were for the most part of 2013. Shipping rates in the spot market have risen lately due to the lower capacity growth we saw in Part 4, higher oil prices that shipping companies are passing on to customers, and increased iron ore import from China.
Higher imports have been driven by continuous growth in China’s steel output, a record-low inventory figure of ~57 million tons in March (a number unseen for three years) and a decline of ~$40 per metric tonne (28%) since the government began tightening the property market in February that has made imported iron ore more attractive. Capesize vessels, which primarily haul major bulk materials such as iron ore and coal, have benefited most.
Prospects for the rest of 2013
Although iron ore prices have risen to a recent high of $131.5 per metric tonne (potentially a short-term negative for imports), iron ore prices are expected to fall as Australia and Brazil boost capacity by the end of this year, which would be positive for dry bulk shippers. Low inventories and continuous steel production China—despite what markets have been fearing—should help absorb the increase in supply. In addition, as U.S. rain improves prospects for a record corn output this year, grain shipments are expected to grow by 8% on an annual basis, likely to support Panamax rates.
If the capacity trend we’ve seen in Part 4 continues, we’ll likely end up seeing higher shipping rates during the second half of 2013, compared to the first half—a positive for companies such as Diana Shipping Inc. (DSX), Navios Maritime Partners LP (NMM), Eagle Bulk Shipping Inc. (EGLE), Knightsbridge Tankers Ltd. (VLCCF), and Safe Bulkers Inc. (SB).
Learn more about the key performance indicators of the dry bulk shipping industry
Continue to Part 6: Forward contracts for the most exciting developments last week, or go back to Part 1 to see the list of key shipping indicators.
