Analyzing the Yield Curve’s Ongoing Flatness
A December rate hike and a flattening yield curve The Fed rolled out another rate hike at its final meeting of 2017. The target range for the federal funds rate was increased by 0.25% to 1.25%–1.50%, and the Fed has signaled three more rate hikes in 2018. Two members dissented to the rate hike due to lower […]
Jan. 4 2018, Published 1:46 p.m. ET

A December rate hike and a flattening yield curve
The Fed rolled out another rate hike at its final meeting of 2017. The target range for the federal funds rate was increased by 0.25% to 1.25%–1.50%, and the Fed has signaled three more rate hikes in 2018. Two members dissented to the rate hike due to lower inflation (TIP), which is flattening the yield curve.
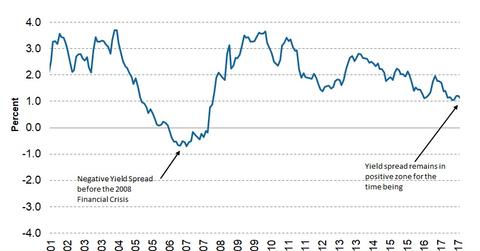
If expectations for inflation remain low, long-term yields (TLT) will likely not move by the same percentage as short-term rates, which narrows credit spreads between long-term and short-term yields, resulting in a flat yield curve. An inverted yield curve is considered a sign of future recession.
Yield spreads used in the Leading Economic Index
The Conference Board LEI (Leading Economic Index) uses the yield spread between ten-year Treasury bonds (IEF) and the federal funds rate (TBF) as a component. According to the latest report, the yield spread reduced from 1.21 to 1.19 between October and November. This credit spread, which has a weight of 11% in the LEI, had a net positive effect of 0.13 (or 13%) in November.
Yield spread outlook
If inflation expectations stay the same, further flattening of the yield curve cannot be ruled out. The Fed continues to signal further rate hikes despite lower inflation (VTIP), and further narrowing of the yield spread between short-term and long-term rates could lead to yield curve inversion.
