Oil Prices Fall despite the Draw in US Crude Oil Inventories
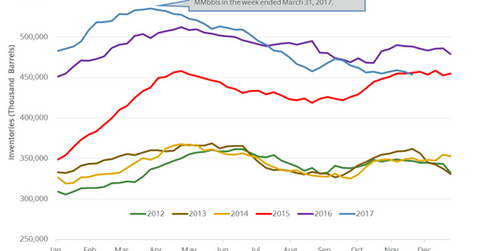
The EIA estimated that US crude oil inventories fell by 3.4 MMbbls (million barrels) to 453.7 MMbbls on November 17–24, 2017.
Nov. 20 2020, Updated 5:16 p.m. ET

US crude oil inventories  
The EIA released its crude oil inventory on November 29, 2017. It estimated that US crude oil inventories fell by 3.4 MMbbls (million barrels) to 453.7 MMbbls on November 17–24, 2017. Inventories fell 0.75% week-over-week and by 34 MMbbls or 7.1% year-over-year.
Wall Street analysts estimated that US oil inventories would have fallen by 2.3 MMbbls on November 17–24, 2017. US oil (USO) (DBO) prices fell on November 29, 2017, despite the larger-than-expected draw in US oil inventories. We discussed the bearish drivers for oil (UCO) (DWT) prices in Part 1 of this series.
US crude oil inventories partially fell due to the Keystone oil pipeline shutting down. The shutdown partially led to the fall in Cushing crude oil inventories. Cushing crude oil inventories fell by 2.9 MMbbls on November 17–24, 2017. It was the largest weekly fall in eight years. The Keystone pipeline restarted on November 28, 2017.
US oil (UWT) (DWT) prices are near June 2015 highs. Volatility in oil prices impacts energy producers (IYE) (FXN) like ConocoPhillips (COP), EOG Resources (EOG), and Newfield Exploration (NFX).
Impact of US crude oil inventories  
US crude oil inventories have fallen by 81.1 MMbbls (million barrels) or 15.3% from the peak in March 2017. Any fall in inventories is bullish for oil (DTO) (OIL) prices. However, US crude oil inventories are ~53 MMbbls or 13% above their five-year average for the week ending November 24, 2017, which is bearish for oil prices. If the difference declines, it’s a bullish sign for prices.
Next, we’ll discuss US crude oil production.
