1 Technical Trend That Could Affect Gold Prices
Investor complacency doesn’t hide the fact that there are financial risks to QT. Forty percent of the Fed’s balance sheet unwind is in mortgage-backed securities at the same time that the housing market is showing signs of slowing.
Oct. 31 2017, Updated 9:01 a.m. ET

VanEck
Investor complacency doesn’t hide the fact that there are financial risks to QT. Forty percent of the Fed’s balance sheet unwind is in mortgage-backed securities at the same time that the housing market is showing signs of slowing. The Fed plans to ramp its bond runoff to $50 billion per month or $600 billion per year. In her latest comments, Chair Yellen sounds set on raising rates four times through 2018. As the Fed chokes off the juice that fed the feeble post-crisis expansion, it is not hard to imagine complacency turning to fear.
Gold Technical Pattern Supports Positive Long-Term Outlook
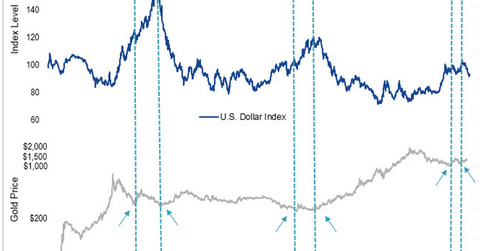
We found this DXY/Gold chart compelling in our December 2016 report. Here we have an updated chart that we find even more compelling.
Notice the double bottoms gold experienced in 1985 and 2001 that coincided with major tops in the DXY and the beginning of a cyclical gold bull market in 1985 and a secular gold bull market in 2001. The most important new development is the fall in the U.S. dollar this year, shown on the far right hand of the DXY chart. This looks like the end of a U.S. dollar bull market that ran from 2011 to 2017. It also looks like gold has established a double bottom in December 2015 and December 2016. While the gold price consolidates its August gains and faces the headwinds of the next Fed rate increase, the long-term technical chart suggests stronger prices for longer are possible. We believe the fundamentals support this technical outlook as the economic expansion ages and significant shifts in central bank policies and geopolitics create risks that drive investors to gold and gold stocks.
Market Realist
Historically, the US dollar (UUP) has tended to have very long bull markets, lasting several years. As gold (OUNZ)(GLD) is US dollar–denominated, it tends to have a negative correlation with the dollar. So gold prices typically remain subdued when the dollar is strong.
The most recent period of dollar strength lasted for six years between 2011 and 2016. Gold lost over 30% of its value over that period. However, it looks like the period of dollar dominance is coming to an end, as other economies are improving and planning to taper their own versions of quantitative easing.
While the US economy is solid, investors are looking to invest abroad as US equities (SPY) look richly valued. Moreover, emerging markets (VWO) are at a much better standing than they were a couple years ago. The outflow of funds may also put downward pressure on the dollar going forward.
