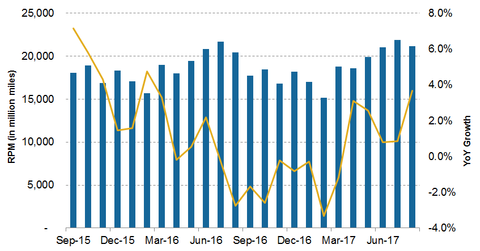
American Airlines’ Traffic Growth Exceeds Its Capacity Growth
For August 2017, AAL’s international traffic increased 6.9% year-over-year. Year-to-date, its international traffic has increased 5.5% YoY.
Sept. 15 2017, Updated 9:14 a.m. ET

Traffic growth
For August 2017, American Airlines’ (AAL) traffic grew 3.7% year-over-year (or YoY), higher than the capacity growth in the same period. Year-to-date (or YTD), AAL’s traffic has increased 0.9% YoY, almost matching its capacity growth during the same period.
This trend is in contrast to 2016 when AAL’s traffic growth mostly lagged its capacity growth. Airline traffic is measured by revenue passenger miles (or RPM), which is the number of revenue passengers multiplied by the total distance traveled.
Domestic markets
AAL’s domestic traffic increased 2.1% year-over-year in August 2017, thanks to the increase in capacity. However, year-to-date, AAL’s domestic traffic has fallen 1.7% YoY.
In contrast, its peers Alaska Air Group (ALK), United Continental (UAL), and Delta Air Lines (DAL) reported strong growth in the domestic markets.
Pacific region records the highest growth
American Airlines’ international traffic growth mostly originated from the Pacific region. On the other hand, Delta Air Lines and United Continental reported higher growth in the Latin American markets.
For August 2017, AAL’s international traffic increased 6.9% year-over-year. Year-to-date, its international traffic has increased 5.5% YoY. Its 20.8% YoY growth in its Pacific region traffic helped achieve this growth. AAL’s Atlantic region traffic rose 6.1% YoY, and its Latin American traffic fell 1.3% YoY during the same period.
In the next part, we’ll discuss how these supply and demand factors have affected AAL’s unit revenues. Investors can gain diversified exposure to AAL by investing in the PowerShares Dynamic Large Cap Value Portfolio ETF (PWV), which invests 1.6% of its portfolio in AAL.
