Understanding the Urea Cost Curve for CF Industries
Not only did CF Industries’ earnings fall year-over-year (or YoY) in 1Q17, its margins were also significantly lower YoY. To understand why, let’s dig deeper into the cost curve.
June 27 2017, Updated 4:35 p.m. ET

The cost curve
Earlier in this series, we discussed how CF Industries’ (CF) earnings have fallen in recent quarters and how this has affected its stock price.
Not only did CF Industries’ earnings fall year-over-year (or YoY) in 1Q17, its margins were also significantly lower YoY. To understand why its margins contracted, let’s dig deeper into the cost curve.
Understanding the cost curve
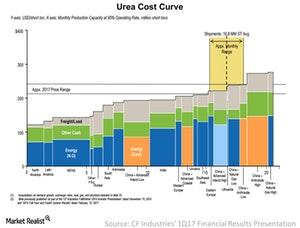
In the chart above, we can see urea producers stacked next to each other in ascending order of total production cost by country. The cost of production is made up of three costs: energy costs, other cash costs, and freight and load costs.
On the leftmost side of the x-axis in the chart is the lowest-cost producer of urea, which in this case is North America. On the rightmost side is the highest-cost producer of urea, which in this case is China. Note that China is able to produce urea at a much lower cost by using coal as an energy source.
How much to produce?
We can answer the question of how much urea to produce by considering the level of demand for it in the market. In the chart, this demand is estimated to be at an average of 16.8 million short tons in 2017. The level of shipments, in turn, determine the market price for urea, which in this case is estimated to be between $210 per ton and $245 per ton for 2017.
As demand moves lower or higher on the spectrum of producers, market prices move along with it. When demand rises, the next-lowest-cost producer comes online and is known as the marginal producer. As demand continues to rise, the market price rises, and so does the gap between the cost of production for lower-cost producers and their market prices, helping to expand their margins.
Investors (MOO) in PotashCorp (POT), CVR Partners (UAN), and Terra Nitrogen (TNH) will likely want to closely monitor urea demand and prices.
