Urea Cost Curve Steepens: What It Means for CF Industries
Urea prices have fallen by an average of 14% annually over the past five years. The consistent fall has been due to falling energy costs, leading to lower production costs across the board.
March 23 2017, Updated 10:36 a.m. ET

Energy costs impact prices
Earlier in this series, we learned that urea prices have fallen by an average of 14% annually over the past five years. The consistent fall has been due to falling energy costs, leading to lower production costs across the board.
However, things appear to be turning around. In this article, we’ll take a look at this change in detail.
Urea cost curve
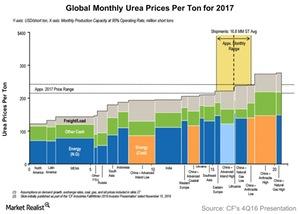
According to the above chart, total global monthly urea shipments are expected to average 16.3 million short tons in 2017.
The marginal producer at that level of demand is primarily concentrated in China, indicating that the urea price floor (the bottom of the two horizontal dashed lines) is set by Chinese producers. Thus, production costs in China are key for global urea prices. Since 2016, the price floor has moved upward.
Cost curve steepens
The cost curve for urea prices has steepened since 2Q16 as a result of rising energy costs for marginal producers. In 2Q16, the price floor moved slightly higher. The rise in Chinese coal prices, lower subsidies from the government, and low urea prices made the cost of production unsustainable for marginal producers.
As a result, Chinese producers’ average urea operating rate fell to ~50%, according to CF Industries. Such conditions could create a favorable environment for low-cost producers (NANR), especially those that use natural gas such as CF Industries, PotashCorp (POT), Agrium (AGU), and Terra Nitrogen (TNH).
