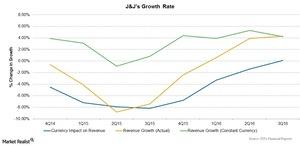
Johnson & Johnson’s Revenue Trend in 3Q16
In 3Q16, Johnson & Johnson’s (JNJ) top line rose 4.2% to ~$17.8 billion, driven by 4.3% operational growth in revenues.
Dec. 9 2016, Updated 9:36 a.m. ET

Johnson & Johnson’s revenue trend
In 3Q16, Johnson & Johnson’s (JNJ) top line rose 4.2% to ~$17.8 billion, driven by 4.3% operational growth in revenues. Its revenues were offset by a 0.1% negative currency impact.
At constant exchange rates, JNJ’s Consumer segment’s revenues rose 0.1%, its Pharmaceutical segment’s revenues rose 9.0%, and its Medical Devices segment’s revenues rose 0.7% during 3Q16. JNJ’s 3Q16 revenues were $17.8 billion, which surpassed the analysts’ estimates of $17.7 billion.
The chart above shows that foreign exchange rates had a constant negative impact on the growth rate of Johnson & Johnson (JNJ) in each quarter, mainly because more than 47% of the company’s total revenues are reported from sales outside the US. The company operates over 134 manufacturing facilities and eight innovation and research centers worldwide.
3Q16 performance
Johnson & Johnson’s (JNJ) revenues have increased over the past few years, following the restructuring of its business segments. The company’s revenues also benefited from the strong performance of several key products such as Xarelto, Zytiga, Remicade, Stelara, and Olysio.
Geographically, the US markets contributed nearly 52.8% of total revenues at $9.4 billion for 3Q16, an increase of ~6.8% in revenues compared to 3Q15. The international markets reported constant-currency operational growth, partially offset by the negative impact of currencies.
In the international markets, Europe contributed ~21.3% of JNJ’s total revenues for 3Q16 at $3.8 billion, an ~0.9% fall over 3Q15. In 3Q16, the Asia-Pacific and Africa markets contributed ~18.0% of the company’s total revenues at $3.2 billion, an ~0.4% increase over 3Q15. During the same quarter, the Western hemisphere (excluding the US) contributed ~7.9% of JNJ’s total revenues at $1.4 billion, a 0.9% decrease over 3Q15.
To divest the risk of investing in individual companies, investors can consider ETFs like the First Trust NASDAQ Pharmaceuticals ETF (FTXH). FTXH holds 8.3% of its total assets in Johnson & Johnson (JNJ), 8.7% in Merck (MRK), 8% in Abbott Laboratories (ABT), and 4.4% in Prestige Brands Holdings (PBH).
