Bunge Limited Has Declared Dividends
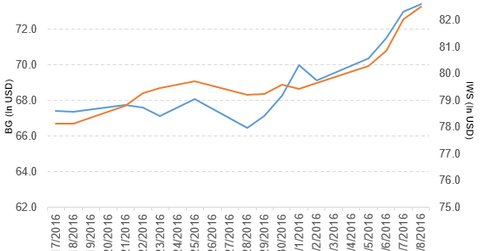
Price movement Bunge Limited (BG) has a market cap of $10.4 billion. It rose 0.55% to close at $73.40 per share on December 8, 2016. The stock’s weekly, monthly, and year-to-date (or YTD) price movements were 4.9%, 5.4%, and 10.4%, respectively, on the same day. BG is trading 7.8% above its 20-day moving average, 14.4% […]
Dec. 12 2016, Updated 8:06 a.m. ET

Price movement
Bunge Limited (BG) has a market cap of $10.4 billion. It rose 0.55% to close at $73.40 per share on December 8, 2016. The stock’s weekly, monthly, and year-to-date (or YTD) price movements were 4.9%, 5.4%, and 10.4%, respectively, on the same day. BG is trading 7.8% above its 20-day moving average, 14.4% above its 50-day moving average, and 20.7% above its 200-day moving average.
Related ETF and peers
The iShares Russell Mid-Cap Value ETF (IWS) invests 0.26% of its holdings in Bunge Limited. The YTD price movement of IWS was 22.0% on December 8. The market caps of Bunge’s competitors are as follows:
Bunge declares dividends
Bunge Limited has declared a regular quarterly cash dividend of $0.42 per share on its common stock. The dividend will be paid on March 2, 2017, to shareholders of record on February 16, 2017.
The company has also declared a quarterly cash dividend of $1.22 per share on its 4.9% cumulative convertible perpetual preference shares. The dividend will be paid on March 1, 2017, to shareholders of record on February 15, 2017.
Latest news on Bunge Limited
Thomas Boehlert has been appointed as Bunge’s EVP (executive vice president) and chief financial officer, effective January 1, 2017. Boehlert will report to Soren Schroder, the company’s chief executive officer.
Performance of Bunge in 3Q16
Bunge Limited (BG) reported 3Q16 net sales of $11.4 billion, a rise of 5.6% over the net sales of $10.8 billion in 3Q15. Sales from its Agribusiness, Edible Oil Products, Milling Products, Sugar and Bioenergy, and Fertilizer segments rose 4.5%, 4.1%, 14.7%, 20.5%, and 8.4%, respectively, between 3Q15 and 3Q16. The company’s gross profit margin and total segment EBIT (earnings before interest and tax) margin fell 200 basis points and 190 basis points, respectively.
Its net income and EPS (earnings per share) fell to $116 million and $0.83, respectively, in 3Q16, compared with $229 million and $1.56, in 3Q15. Bunge’s cash and cash equivalents fell 27.7%, and its inventories rose 15.8% between 4Q15 and 3Q16. Its current ratio fell to 1.4x, and its debt-to-equity ratio rose to 1.8x in 3Q16, compared with 1.5x and 1.7x, respectively, in 4Q15.
Projections
Bunge Limited has made the following projections for fiscal 2016:
- EBIT for Food and Ingredients of $230 million–$240 million
- EBIT for Fertilizer of ~$30 million
- EBIT for Sugar and Bioenergy of $60 million–$70 million
In the next part, we’ll look at Post Holdings (POST).
