Why Ingredion Acquired Sun Flour’s Rice Starch and Rice Flour Business
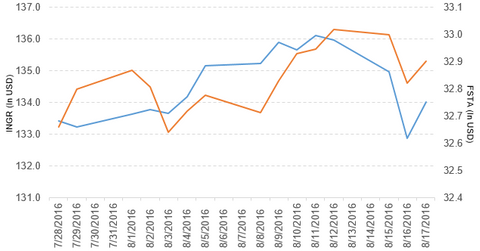
Ingredion (INGR) has a market cap of $9.7 billion. It rose by 0.87% to close at $134.02 per share on August 17, 2016.
Nov. 20 2020, Updated 11:19 a.m. ET

Price movement
Ingredion (INGR) has a market cap of $9.7 billion. It rose by 0.87% to close at $134.02 per share on August 17, 2016. The stock’s weekly, monthly, and year-to-date (or YTD) price movements were -1.2%, 0.96%, and 41.0%, respectively, on the same day. INGR is trading 0.07% above its 20-day moving average, 3.6% above its 50-day moving average, and 22.9% above its 200-day moving average.
Related ETFs and peers
The Fidelity MSCI Consumer Staples ETF (FSTA) invests 0.38% of its holdings in Ingredion. The ETF tracks a market-cap-weighted index of stocks in the US consumer staples sector. The YTD price movement of FSTA was 9.3% on August 17.
The SPDR S&P 400 Mid-Cap Growth ETF (MDYG) invests 0.59% of its holdings in Ingredion. The ETF tracks a market-cap-weighted index of growth companies culled from the S&P 400.
The market caps of Ingredion’s competitors are as follows:
Latest news on Ingredion
Ingredion has entered into an agreement with Sun Flour Industry, which is based in Banglen, Thailand, to acquire its rice starch and rice flour business and to increase the higher-value specialty ingredients business.
The company reported, “It is subject to approval by Thai government authorities as well as to other customary closing conditions.” The company added, “once the acquisition is complete, Ingredion will have four manufacturing facilities and 870 employees in Thailand, including the 120 employees joining the company from Sun Flour.”
Performance of Ingredion in 2Q16
Ingredion reported 2Q16 net sales of $1.46 billion, a rise of 0.44% over the net sales of $1.45 billion in 2Q15. Sales of the North America and EMEA (Europe, the Middle East, and Africa) regions rose by 3.0% and 1.7%, respectively. Sales of the South America and Asia-Pacific regions fell by 4.0% and 6.1%, respectively, between 2Q15 and 2Q16. The company’s gross profit margin and operating income rose by 10.8% and 14.6%, respectively. It reported a restructuring charge of $13.0 million in 2Q16.
Its net income and EPS (earnings per share) rose to $117.2 million and $1.58, respectively, in 2Q16, compared with $106.7 million and $1.47, respectively, in 2Q15. It reported adjusted EPS of $1.73 in 2Q16, a rise of 13.1% from 2Q15.
INGR’s cash and cash equivalents and inventories rose by 12.2% and 6.7%, respectively, between 4Q15 and 2Q16. Its current ratio rose to 3.1x and its debt-to-equity ratio fell to 1.2x in 2Q16, compared with 2.6x and 1.3x, respectively, in 4Q15.
Projections
The company has made the following projections for fiscal 2016:
- adjusted EPS in the range of $6.70 to $6.90, which excludes acquisition-related and integration costs and impairment and restructuring costs
- effective tax rate of ~30%–32%
- cash generated from operations in the range of $725 million to $775 million
- capital expenditures of $300 million
For an ongoing analysis of this sector, please visit Market Realist’s Consumer Discretionary page.
