Snyder’s-Lance Declares Dividend of $0.16 per Share
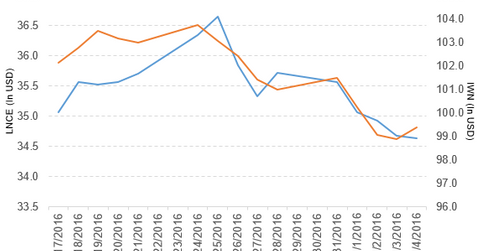
Snyder’s-Lance (LNCE) has a market cap of $3.4 billion. It fell 0.12% to close at $34.64 per share on November 4, 2016.
Nov. 9 2016, Updated 8:06 a.m. ET

Price movement
Snyder’s-Lance (LNCE) has a market cap of $3.4 billion. It fell 0.12% to close at $34.64 per share on November 4, 2016. The stock’s weekly, monthly, and year-to-date (or YTD) price movements were -3.0%, 1.8%, and 2.5%, respectively, on the same day.
LNCE is trading 1.9% below its 20-day moving average, 0.18% below its 50-day moving average, and 5.8% above its 200-day moving average.
Related ETF and peers
The iShares Russell 2000 Value ETF (IWN) invests 0.34% of its holdings in LNCE. The ETF tracks an index of US small-cap value stocks. The index selects value stocks from a universe of stocks ranked 1,001–3,000 by market cap. The YTD price movement of IWN was 9.6% on November 4.
The market caps of Snyder’s-Lance’s competitors are as follows:
Snyder’s-Lance declared dividend
Snyder’s-Lance has declared a regular quarterly cash dividend of $0.16 per share on its common stock. The dividend will be paid on November 29, 2016, to shareholders of record at the close of business on November 21, 2016.
Performance of Snyder’s-Lance in fiscal 2Q16
Snyder’s-Lance (LNCE) reported fiscal 2Q16 net revenue of $609.5 million, a rise of 41.3% compared to net revenue of $431.4 million in fiscal 2Q15. Its net income rose to $19.7 million and its EPS (earnings per share) fell to $0.20 in fiscal 2Q16 compared to net income and EPS of $17.3 million and $0.24, respectively, in fiscal 2Q15.
Snyder’s-Lance reported adjusted EBITDA[1. earnings before interest, tax, depreciation, and amortization] and adjusted EPS of $78.6 million and $0.28, respectively, in fiscal 2Q16, a rise of 56.6% and 3.7%, respectively, compared to fiscal 2Q15.
LNCE’s cash and cash equivalents fell 3.6% and its inventories rose by 106.0% in fiscal 2Q16 compared to fiscal 4Q15. Its current ratio fell to 1.7x, and its debt-to-equity ratio rose to 1.1x in fiscal 2Q16 compared to a current ratio and a debt-to-equity ratio of 2.2x and 0.63x, respectively, in fiscal 4Q15.
Projections
Snyder’s-Lance (LNCE) has made the following projections for fiscal 2016:
- net revenue in the range of $2.29 billion–$2.33 billion, which excludes the contribution from Diamond Foods’s net revenue growth of flat to 2%.
- adjusted EBITDA in the range of $313 million–$325 million
- capital expenditures in the range of $80 million–$85 million
- EPS in the range of $1.22–$1.30, which excludes special items and charges of acquisition of Diamond Foods
- effective tax rate in the range of 34%–35%
It expects EPS in the range of $0.28–$0.31 for fiscal 3Q16.
Now we’ll look at Estee Lauder Companies (EL).
