General Mills Made Key Changes in Its Management
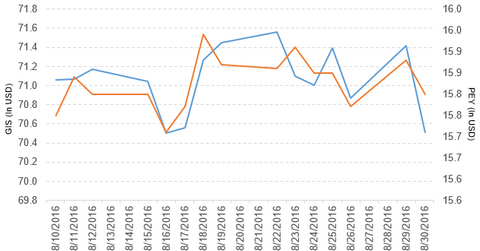
General Mills (GIS) has a market cap of $42.6 billion. It fell by 1.3% to close at $70.51 per share on August 30, 2016.
Sept. 1 2016, Updated 8:05 a.m. ET

Price movement
General Mills (GIS) has a market cap of $42.6 billion. It fell by 1.3% to close at $70.51 per share on August 30, 2016. The stock’s weekly, monthly, and year-to-date (or YTD) price movements were -0.83%, -1.6%, and 25.0%, respectively, on the day.
GIS is trading 0.61% below its 20-day moving average, 0.04% above its 50-day moving average, and 13.8% above its 200-day moving average.
Related ETF and peers
The PowerShares High Yield Equity Dividend Achievers ETF (PEY) invests 1.6% of its holdings in General Mills. The ETF aims to track a yield-weighted index of US companies that have increased their annual dividends for at least ten consecutive years. The YTD price movement of PEY was 21.1% on August 30.
The market caps of General Mills’ competitors are as follows:
Latest news on General Mills
Jon Nudi has been appointed as the senior vice president and president of the company’s US Retail segment.
Bethany Quam has been appointed as the senior vice president and president of the company’s Europe and Australasia segment.
General Mills’ performance in fiscal 4Q16 and fiscal 2016
General Mills reported fiscal 4Q16 net sales of $3.9 billion, a fall of 9.3% from its net sales of $4.3 billion in fiscal 4Q15. Sales from the US Retail, International, and Convenience Stores and Foodservice segments fell by 12.2%, 1.5%, and 7.8%, respectively, between fiscals 4Q15 and 4Q16.
In fiscal 4Q16, its net income and EPS (earnings per share) rose to $379.6 million and $0.62, respectively, compared to $186.8 million and $0.30, respectively, in fiscal 4Q15.
Fiscal 2016 results
In fiscal 2016, GIS reported net sales of $16.6 billion, a fall of 5.7% YoY (year-over-year). It reported a gain on divestitures of $148.2 million in fiscal 2016. YoY, the company’s gross profit margin and operating profit rose by 4.5% and 30.3%, respectively.
In fiscal 2016, GIS’s net income and EPS rose to $1.7 billion and $2.77, respectively, compared to $1.2 billion and $1.97, respectively, in fiscal 2015. In fiscal 2016, GIS’s cash and cash equivalents rose by 128.5%, and its inventories fell by 8.3%. In fiscal 2016, its current ratio and debt-to-equity ratio rose to 0.79x and 2.93x, respectively, compared to 0.75x and 2.90x, respectively, in fiscal 2015.
Projections
The company has made the following projections for fiscal 2017:
- organic net sales growth of between 0% and -2%
- total segment operating profit growth in the range of 6%–8% on a constant-currency basis
- adjusted operating profit margin growth of ~1.5%
- adjusted EPS growth in the range of 6%–8% on a constant-currency basis
The company has made the following projections for fiscal 2018:
- modest organic net sales growth
- adjusted EPS growth in the low double digits on a constant-currency basis
In the next part of this series, we’ll discuss Goodyear Tire & Rubber Company (GT).
