WisdomTree U.S. SmallCap Dividend Fund
Latest WisdomTree U.S. SmallCap Dividend Fund News and Updates

How Does Herman Miller Compare to Its Peers?
Based on the gross profit margins and EPS, Herman Miller outperformed its peers. However, the peers outperformed it based on the current ratio and PE and PBV ratios.

Organic Growth Boosts Herman Miller’s Performance
Herman Miller has a market cap of $1.67 billion. Its YTD performance is stable. After the 1Q16 earnings report, it rose by 1.24% to close $27.86 per share.

Worthington Industries’ Revenue and Income Fell in Fiscal 2Q16
Worthington has a market cap of $1.7 billion. After the fiscal 2Q16 earnings report, it rose by 0.11% to close at ~$27.0 per share as of December 16.

What Has Hormel Foods Planned for Fiscal 2016?
Hormel Foods (HRL) announced a 16% increase in its annual dividend, effective fiscal 2016. The annual dividend is now raised to $1.16 per share to be paid in fiscal 2016.

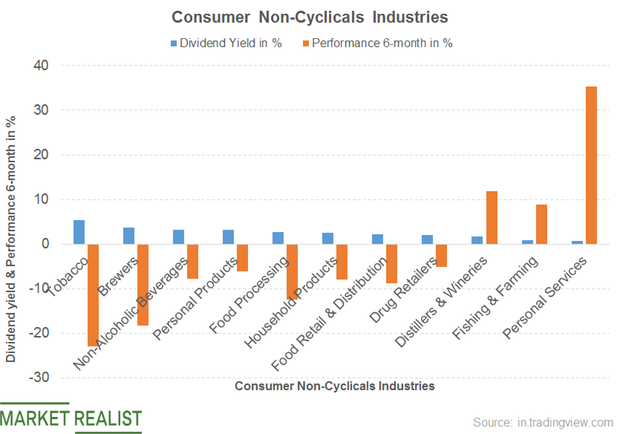
What’s the Dividend Yield of the Consumer Non-Cyclical Sector?
The consumer non-cyclical segment recorded a dividend yield of 3%.

A Look at the Earnings and Revenue Drivers for AES
What drove the EPS growth for AES? AES Corporation’s (AES) cost of sales dropped 1.0% in 2016 before rising 4.0% in 9M17. As a result, its gross profit fell 15.0% in 2016 before expanding 11.0% in 9M17. AES Corporation’s general and administrative expenses decreased 1.0% in 2016 and rose 15.0% in 9M17. This led to […]

Can New Amendments Extend Patterson-UTI Energy’s Credit Commitment?
Patterson-UTI Energy’s net debt-to-EBITDA Patterson-UTI Energy’s (PTEN) net debt-to-TTM (trailing-12-month) EBITDA (earnings before interest, tax, depreciation, and amortization) trended upward from fiscal 2Q15 through fiscal 2Q16. In 2Q16, Patterson-UTI Energy’s net debt-to-EBITDA was 2.7x, or 208% higher than one year previously. Remember, net debt-to-EBITDA reflects how easily a company can repay its debts from its […]

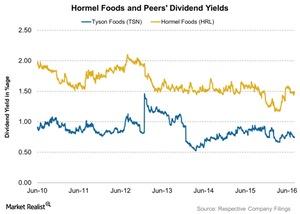
How Much Has Hormel Returned to Shareholders in Fiscal 2016?
Along with its 3Q16 results, Hormel Foods (HRL) also announced the 352nd consecutive quarterly dividend at the annual rate of $0.58 per share.

How Much Will Rig Count Affect Patterson-UTI Energy in Fiscal 3Q16?
In 2Q16, the US rig count declined by 51% over one year previously. During this period, the international rig count decreased by only 19%.

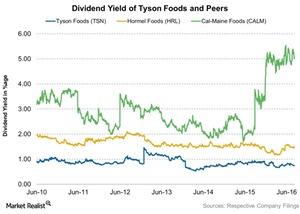
How Much Has Tyson Foods Returned to Shareholders in Fiscal 2016?
Tyson Foods bought back 6.6 million shares in fiscal 3Q16 and has bought back another 5.4 million shares so far in fiscal 4Q16.

Inside the Analyst Forecasts for Patterson-UTI Energy after Its 2Q16 Earnings
Approximately 52% of analysts tracking Patterson-UTI Energy (PTEN) rated it a “buy” or some equivalent. Approximately 34% rated the company a “hold.”

Has PTEN’s Correlation with Crude Oil Decreased since 1Q16?
PTEN’s correlation with crude oil price has increased marginally since the end of 1Q16 through July 8, 2016, compared to the past year.

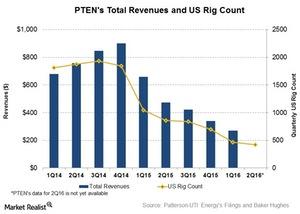
Will Rig Count Affect Patterson-UTI Energy in 2Q16?
In 1Q16, the US rig count declined by 56% over 1Q15. During this period, the international rig count decreased by only 21%.

What Does Patterson-UTI Energy’s Current Valuation Imply?
Patterson-UTI Energy’s (PTEN) adjusted earnings were negative in fiscal 1Q16.

Could Patterson-UTI Energy Violate Debt Covenants in 2Q16?
As of March 31, 2016, Patterson-UTI Energy had a $65 million debt under a senior unsecured term loan.

How Does Worthington Industries Compare to Its Peers?
The PE ratios of Worthington Industries, Nucor, Alcoa, and Reliance Steel & Aluminum are 28.1x, 19.7x, 23.7x, and 12.9x, respectively, as of December 16.