S&P 500 Death Cross: What Does It Mean and Should You Be Worried?
There has been a death cross formation in the S&P 500 Index. What’s does the death cross mean and should investors be worried now?
March 15 2022, Published 12:24 p.m. ET

A death cross is a bearish technical indicator. On March 14, there was a death cross formation in the S&P 500 Index, which is the world’s most popular index. What’s the meaning of the death cross and should investors be worried about the technical pattern?
First, we should understand that the death cross isn't limited to stock indices alone. There can be a death cross in any traded asset. Along with stocks, there can be death cross in commodities and cryptocurrencies.
What is a death cross?
The death cross forms when an asset’s 50-day SMA (simple moving average) falls below the 200-day SMA. It's a bearish pattern, but traders see it as a lagging indicator. The asset is already in a downtrend when a death cross forms. A death cross often signals the continuation of a bearish trend.
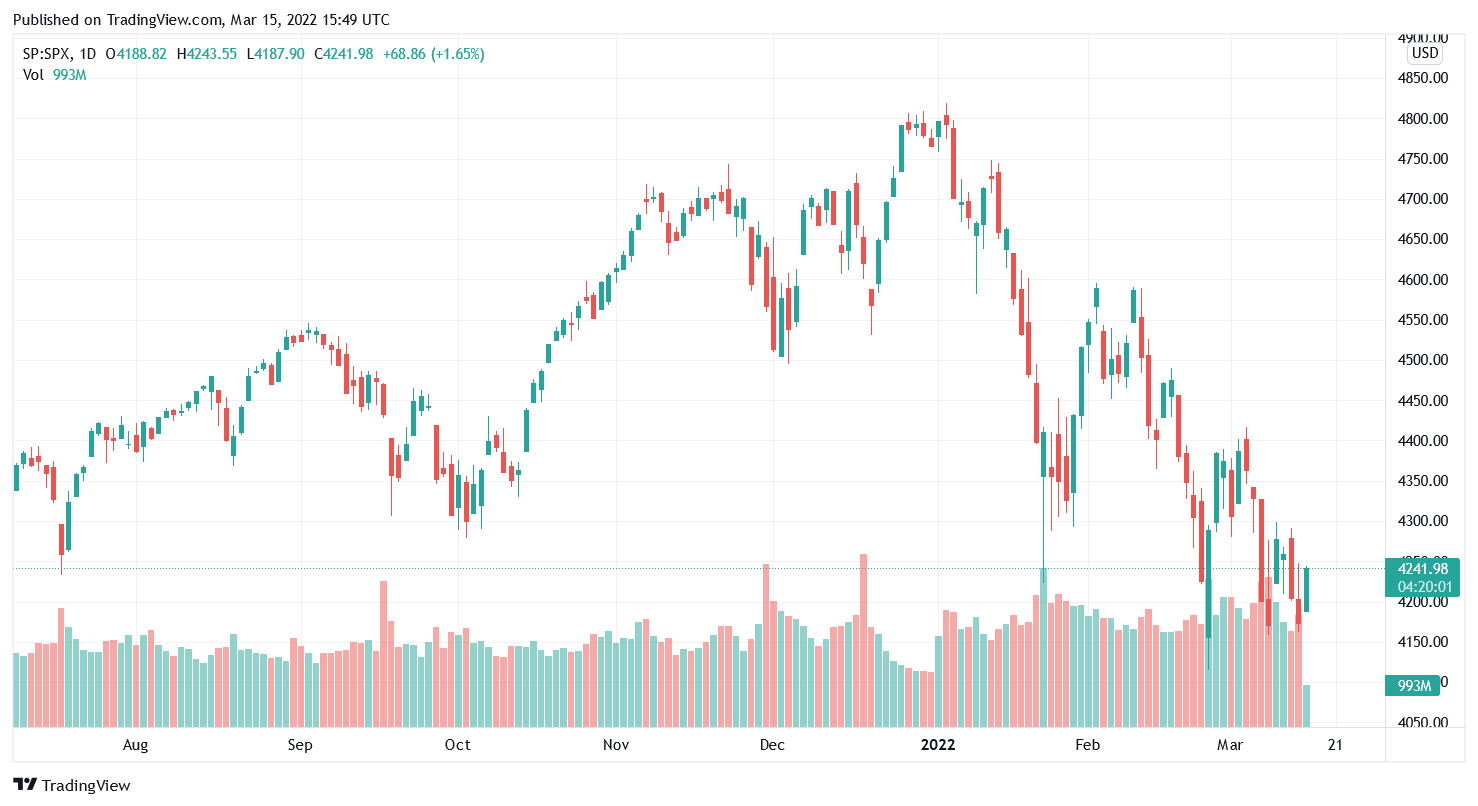
For example, the S&P 500 is in a correction zone and has fallen over 10 percent from the peaks. Many now fear that a bear market, which means a 20 percent fall from the peak, is a real possibility.
How is the death cross different than the golden cross?
A golden cross is the opposite of a death cross. It's a bullish technical indicator that forms when an asset’s 50-day SMA rises above the 200-day SMA. Like the death cross, the golden cross is also a lagging indicator.

Is the death cross a buying opportunity?
Technical analysts might see death cross as a bearish trend. However, historical data suggest otherwise. According to the Dow Jones Market Data, the average 12-month return from stocks after a death cross is 6.3 percent. That said, the average 12-month return after a death cross is lower than the average 12-month returns from U.S. stocks.
The previous death cross in the S&P 500 was in March 2020. There was a massive sell-off in stocks amid the uncertainty over the COVID-19 pandemic. The Q1 2020 crash ended the historical 11-year bull market in U.S. stocks. It also ended the biggest economic expansion in history as the U.S. economy entered into a recession.
A recession and a death cross would be a lethal combination.
Historical data shows that stocks end up higher over the next 12 months around two-thirds of the time following a death cross. However, if the death cross is accompanied by an economic recession, there's a higher probability that stocks deliver negative returns in the next 12 months following the death cross.
Treasury Secretary Janet Yellen has ruled out a recession for now while warning Americans to be prepared for high inflation. However, a recession can’t be ruled out at the juncture considering the expected increase in interest rates, high inflation, supply chain issues, and geopolitical tensions.
U.S. stock market valuations are still somewhat above the historical average. Over the last two years, bulls have justified higher valuations citing historically low interest rates. Now, with the Fed set to embark on its tightening cycle, where analysts are projecting as many as seven hikes in the year, the valuations might start to appear even richer as the year progresses.