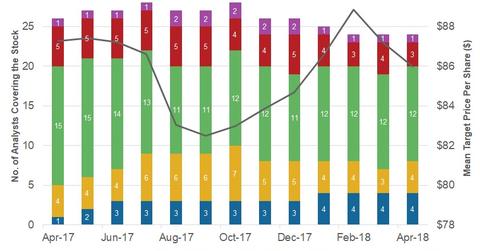
How Analysts Rate XOM
The graph above shows that eight out of the 24 analysts covering XOM have rated it a “buy” in April 2018.
Nov. 20 2020, Updated 3:01 p.m. ET

Analyst ratings for XOM
In the preceding part of this series, we reviewed analyst ratings for Petrobras (PBR). Now we’ll look at analyst ratings for ExxonMobil (XOM), the company that occupies the sixth spot on the list of seven integrated energy stocks with the most “buy” ratings. XOM is an American integrated energy company with upstream, downstream, and chemicals business segments. The company has the largest market cap of around $318 billion among the seven stocks discussed in this series.
The graph above shows that eight out of the 24 analysts covering XOM have rated it a “buy” in April 2018. Another 12 analysts have rated XOM as a “hold.” The remaining four analysts have rated XOM a “sell” or “strong sell.” However, other leading integrated energy companies Chevron (CVX), BP (BP), and Royal Dutch Shell (RDS.A) have “buy” ratings from 78%, 42%, and 91% of analysts, respectively.
Analyst ratings for ExxonMobil have strengthened in April 2018 over April 2017. XOM has seen a rise in “buy” ratings and a decline in “hold” and “sell” ratings in the stated period. However, during the same period, ExxonMobil’s mean target price has fallen 1% to $86 per share. Still, XOM’s mean price target implies a gain of around 15% from the current level. The implied gains have widened due to a steeper decline in ExxonMobil’s stock price compared to the decline in ExxonMobil’s mean target price in the past one year.
Valuations
XOM trades at a forward PE of 16.0x above the average forward PE of 14.7x. Also, XOM trades at 7.1x its forward EV-to-EBITDA, which is above the peer average of 5.8x. ExxonMobil (XOM) is a financially strong company with comfortable leverage and a good liquidity position. The company’s total-debt-to-total-capital ratio stands at 18%. In comparison, CVX, Shell, and BP have ratios of 21%, 30%, and 39%, respectively. Also, XOM has surplus discretionary cash flow after covering its capex and dividend payments. In 2017, XOM’s excess cash flow stood at 6% (as a percentage of cash flow from operation). Plus, XOM’s expansion activities, spread across its business segments, are making its earnings model more “integrated,” protecting it partially from oil price volatility. We have discussed ExxonMobil’s growth activities in ExxonMobil Is All Set to Double Its Earnings: Let’s Take a Look.
Check out all the data we have added to our quote pages. Now you can get a valuation snapshot, earnings and revenue estimates, and historical data as well as dividend info. Take a look!
Move onto the next part to know about analyst ratings for Total (TOT), the company that has the lowest percentage of “buy” ratings from analysts.
