XLU’s Chart Indicators and Short Interest
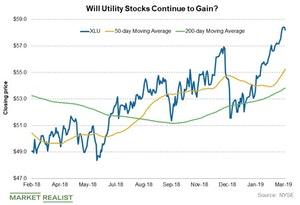
Currently, the Utilities Select Sector SPDR ETF (XLU) is trading at $58.2 after hitting an all-time high of $58.7 last week.
March 18 2019, Updated 1:28 p.m. ET

Chart indicators
Currently, the Utilities Select Sector SPDR ETF (XLU) is trading at $58.2 after hitting an all-time high of $58.7 last week. The premium of 5% and 8% from its current levels to its 50-day and 200-day moving average levels highlights the strength in XLU. The levels close to $55.3 and $53.8 could act as a support for XLU in the short term.
Relative strength index
Utilities (IDU) at large continued to trade in the “overbought” zone lately. XLU’s RSI was 76 at the closing last week. An RSI above 70 implies that the stock is overbought, while an RSI below 30 implies that the stock is oversold. RSI levels at both extremes imply an imminent reversal in the stock’s direction.
Top utility stocks including Southern Company (SO) and Exelon (EXC) trade in the “overbought” zone with their RSI levels close to 80 and 87, respectively. So far, Southern Company is one of the top gainers among utilities in 2019. Southern Company has risen ~18% year-to-date. Southern Company is trading ~4% lower than its all-time high of $53.6 in June 2016.
Short interest
The short interest in XLU increased 8% on February 28. On February 14, there were 41.9 million shorted units, while the total shorted units increased to 45.2 million on February 28.
A rise in the stock’s short interest could imply that more investors expect it to fall from the current price level. The short interest implies the number of a company’s shares that have been sold short and not squared off yet.
