What Miners’ Moving Averages Indicate
NGD and HL are both trading below their longer-term 100-day moving averages.
Jan. 22 2018, Updated 1:36 p.m. ET

Miners’ performance
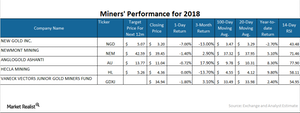
Precious metal miners are known to closely track the performance of precious metals. This article will look at miners like New Gold (NGD), Newmont Mining (NEM), AngloGold Ashanti (AU), and Hecla Mining (HL). Among these four stocks, NEM, AU, and HL have seen YTD gains, whereas NGD has declined about 2.7% during the same timeframe. The VanEck Vectors Junior Gold Miners Fund (GDXJ) has increased almost 2.4% since the beginning of the new year.
Moving averages
The moving average indicator can offer insight into the directional movement of precious metals. NGD and HL are both trading below their longer-term 100-day moving averages. NGD is below its shorter-term 20-day moving average as well. In contrast, NEM and AU are considerably above their 20-day and 100-day moving averages. A massive discount below these moving average indicators could suggest a possible pullback in price, while a considerable premium above it could indicate a dropdown.
The target prices of all the four miners are reasonably higher than their current trading price, which suggests a positive outlook for miners.
Relative strength index
NGD, NEM, AU, and HL had RSI (relative strength index) scores of 43.5, 71.5, 77.9, and 58.1, respectively, as of January 17. The RSI score of GDXJ is 55. An RSI score below 30 indicates a potential rise in prices, while an RSI score above 70 points shows a possible fall in prices.
