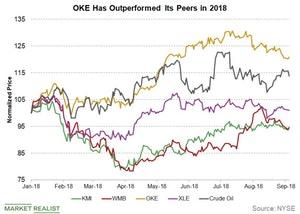
Why ONEOK Has Outperformed Its Peers in 2018
ONEOK (OKE) stock has risen ~21% so far in 2018, outperforming its peers in the midstream sector.
Nov. 20 2020, Updated 10:44 a.m. ET

Stock performance
ONEOK (OKE) stock has risen ~21% so far in 2018, outperforming its peers in the midstream sector. Kinder Morgan (KMI) and Williams Companies (WMB) have each fallen ~5% over the same timeframe. The Energy Select Sector SPDR ETF (XLE) has risen ~1% YTD (year-to-date).
ONEOK’s strong operational performance over the last few quarters has likely contributed to its stock’s recent outperformance. As we discussed earlier in this series, ONEOK’s revenue and earnings grew at a faster pace than its peers’ in 2018.
The above graph compares the YTD performances of Kinder Morgan, Williams Companies, and ONEOK. Crude oil prices have risen ~14% YTD.
Moving averages
ONEOK is trading ~4% below its 50-day moving average and 7% above its 200-day moving average. These two averages may act as resistance and support levels, respectively, for the stock in the near term. The stock fell below its 50-day moving average on August 1, and it’s fallen ~6% since then.
Kinder Morgan is trading close to its 50-day moving average and ~4% above its 200-day moving average. Williams Companies is trading slightly above its 50-day moving average. WMB’s 50-day average may act as a support for its stock in the near term. Williams Companies is trading ~4% above its 200-day moving average.
Next, let’s see how these three midstream stocks compare in terms of their current valuations.
