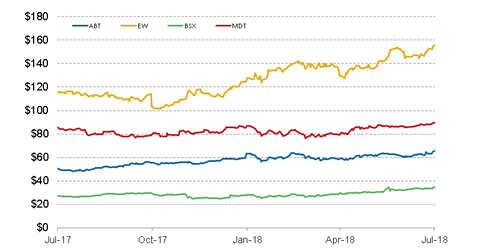
Abbott Laboratories’ Stock Price Performance in July
Year-to-date, ABT stock has risen 12.8%. Over the last month, the stock has returned ~4.0%.
Nov. 20 2020, Updated 2:20 p.m. ET

ABT’s recent stock price performance
On July 24, Abbott Laboratories (ABT) ended the trading day at $64.40 per share. Currently, the stock is trading higher than its 50-day moving average of $62.45 and its 200-day moving average of $60.75.
The company released its second-quarter earnings results on July 18. The company reported stellar results with double-digit growth in its Diabetes, Electrophysiology, and Structural Heart businesses. The company also raised its fiscal 2018 guidance during the earnings release, which came in ahead of analysts’ estimates.
On April 18, ABT stock registered its 52-week high of $65.50, up ~4.3% from the previous day’s close. The stock closed at $64.75 on the day, posting a net rise of ~3.1%.
ABT’s 52-week low trading activity occurred on August 10, 2017, when the company traded at $48.05. On July 24, Abbott Laboratories had a beta of ~1.5, reflecting the stock’s higher volatility compared to the market.
Year-to-date, ABT stock has risen 12.8%. Over the last month, the stock has returned ~4.0%. ABT stock has been trending higher in fiscal 2018 on the strength of its key product launches, reimbursement approvals, collaborations, and data presentations. Abbott Laboratories has risen ~27.0% over the last 12 months.
Peer and market comparisons
On July 24, Abbott Laboratories’ peers Medtronic (MDT), Edwards Lifesciences (EW), and Boston Scientific (BSX) had generated returns of 3.5%, 21.7%, and 31.5%, respectively, over the last 12 months.
Over the same period, the iShares US Medical Devices ETF (IHI) and the S&P 500 Index have risen ~24.0% and ~14.0%, respectively. This trend shows that Abbott Laboratories has surpassed the US medical device industry and the broader market during the last year.
Be sure to check out all the data we’ve added to our quote pages. Now you can get a valuation snapshot, earnings and revenue estimates, and historical data, as well as dividend information. Take a look!
