What Are TD Ameritrade’s Valuations?
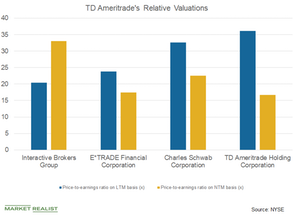
TD Ameritrade’s (AMTD) PE ratio stood at 16.68x on a next 12-month basis, which implies discounted valuations.
June 1 2018, Updated 7:33 a.m. ET

Discounted valuations
TD Ameritrade’s (AMTD) PE ratio stood at 16.68x on a next 12-month basis, which implies discounted valuations. The average for TD Ameritrade’s competitors was 24.32x. Interactive Brokers Group (IBKR), E*TRADE Financial (ETFC), and Charles Schwab (SCHW) have PE ratios of 33.03x, 17.45x, and 22.48x, respectively, on a next 12-month basis.
Sequentially, brokerage companies are expected to witness a decline in their trading activities in the June quarter due to less volatility in the equity markets. April was mainly aided by the strong earnings season. However, there was volatility in May, which might help brokerages improve their monthly metrics compared to April. Global factors fueled volatility in the markets.
What could help brokerage companies?
The trend of digitization is picking up at a rapid pace, which prompts the need to adapt the digital tools in order to attract customers’ attention mainly in payments and the brokerage industry. With digital tools available for trading, market participants can access the equity markets through on smartphones.
TD Ameritrade’s management views that its customers are getting well versed with its mobile trading platform. The trend is expected to continue moving forward, which might have a positive impact on the company’s trading activities. Customers can access the markets immediately following market-moving news.
TD Ameritrade has a PE ratio of 36.17x on a last 12-month basis. TD Ameritrade’s peers (VFH), Interactive Brokers Group, E*TRADE Financial, and Charles Schwab have PE ratios of 20.44x, 23.81x, and 32.66x, respectively, on a last 12-month basis.
