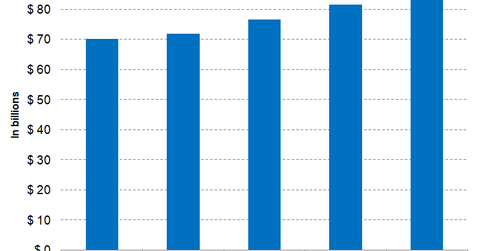
Johnson & Johnson’s Financial Performance
In 1Q18, Johnson & Johnson (JNJ) generated revenue of $20 billion, compared with $17.7 billion in 1Q17.
May 4 2018, Updated 7:23 a.m. ET

Top line
In 1Q18, Johnson & Johnson (JNJ) generated revenue of $20 billion, compared with $17.7 billion in 1Q17. The company is expected to generate revenue of $81.5 billion and $84 billion in fiscal 2018 and fiscal 2019, respectively.
Johnson & Johnson’s costs of products sold rose from $5.4 billion in 1Q17 to $6.6 billion in 1Q18, from 30.4% of revenue to 33.1%. This increase was primarily due to higher amortization expenses and acquisition-related costs associated with Actelion.
Operating expenses
Johnson & Johnson’s selling, marketing, and administrative expenses rose from $4.7 billion to $5.2 billion between 1Q17 and 1Q18, primarily due to research and development expenses rising from $2 billion to $2.4 billion, from 11.7% of revenue to 12%. This increase was due to the company’s continued investments in its product development pipeline.
Bottom line
As a result of the jump in operating expenses, Johnson & Johnson’s net income fell marginally between 1Q17 and 1Q18, from $4.4 billion to $4.3 billion, from 24.9% of revenue to 21.8%. Its net earnings per share fell from $1.61 to $1.60.
Price performance
Year-to-date, Johnson & Johnson stock had fallen 10% to $126 as of May 1. In comparison, peers Pfizer (PFE) and Merck (MRK) had returned -3.6% and 3.3%, respectively.
Valuation
Johnson & Johnson is currently trading at a forward price-to-earnings ratio of 14.7. It has a price-to-earnings-to-growth ratio of 2, a price-to-sales ratio of 4.4, and a price-to-book ratio of 5.6. The company has generated a return on assets of 8.3% and a return on equity of 2.0%.
