Understanding ConocoPhillips Stock’s Correlation with Crude Oil
ConocoPhillips’s stock performance As we saw in the previous part of this series, ConocoPhillips’s (COP) stock price rose ~2% in the week ended March 9, while crude oil (UWT) (SCO) (DWT) rose ~1%, suggesting that COP stock followed crude oil. In this part, we’ll try to quantify this correlation between COP stock and crude oil. ConocoPhillips’s stock […]
March 12 2018, Updated 2:55 p.m. ET

ConocoPhillips’s stock performance
As we saw in the previous part of this series, ConocoPhillips’s (COP) stock price rose ~2% in the week ended March 9, while crude oil (UWT) (SCO) (DWT) rose ~1%, suggesting that COP stock followed crude oil. In this part, we’ll try to quantify this correlation between COP stock and crude oil.
ConocoPhillips’s stock price correlation
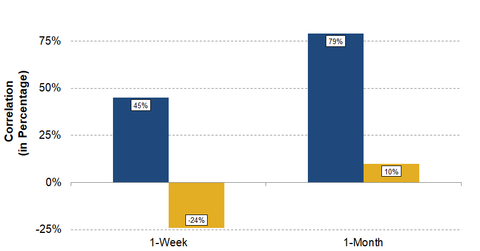
In the week ended March 9, ConocoPhillips stock had a correlation of ~45% with crude oil. In other words, crude oil moved with COP stock on some days last week. This correlation was especially visible on Friday, when crude oil and COP stock both moved up sharply.
ConocoPhillips’s production mix contains almost ~62% crude oil, bitumen, and natural gas liquids. The company’s current operational strategy is geared towards lowering its natural gas production in North America. In the week ended March 9, ConocoPhillips’s correlation with natural gas was approximately -24%, suggesting that price movements in COP stock and natural gas were not in sync.
ConocoPhillips’s correlation over the last month
ConocoPhillips stock has shown a correlation of ~79% and ~10% with crude oil and natural gas, respectively, over the last month. To learn more about energy stocks’ correlation with crude oil, read Why Oil’s Fall Could Erode Energy Stocks’ Gains.
