Inside Visa’s Operating Expenses
Visa (V) saw a rise of 13% in total operating expenses on a YoY (year-over-year) basis in fiscal 1Q18. It incurred $1.5 billion in expenses in fiscal 1Q18 compared to $1.4 billion a year earlier.
Feb. 12 2018, Updated 1:05 p.m. ET

Total operating expenses
Visa (V) saw a rise of 13% in total operating expenses on a YoY (year-over-year) basis in fiscal 1Q18. It incurred $1.5 billion in expenses in fiscal 1Q18 compared to $1.4 billion a year earlier.
The company incurred personnel expenses of $679 million in fiscal 1Q18 compared to $571 million a year ago, implying a rise of 19%. This rise mainly reflected the company’s increase in its number of employees in order to achieve growth.
Visa incurred marketing expenses of $223 million in fiscal 1Q18 compared to $218 million a year ago, reflecting a rise of 3%.
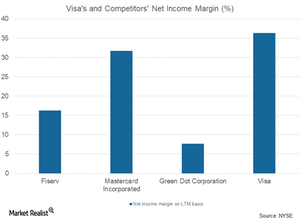
Visa’s net income margin on a trailing-12-month basis stands at 36.4%, and its peers (XLF) Fiserv (FISV), Mastercard (MA), and Green Dot (GDOT) have net income margins of 16.3%, 31.8%, and 7.7%, respectively.
Professional fees
Visa incurred professional fees of $92 million in fiscal 1Q18 compared to $80 million in fiscal 1Q17. This difference reflects a 14% rise mainly as a result of rising incurred consulting fees.
Between fiscal 1Q17 and fiscal 1Q18, the company’s network and processing expenses rose from $145 million to $160 million, primarily due to investments it made in order to achieve growth. The company saw a marginal fall in its depreciation and amortization expenses from $146 million in fiscal 1Q17 to $145 million in fiscal 1Q18—a 1% fall.
Visa incurred general and administrative expenses of $236 million in fiscal 1Q18 compared to $186 million a year earlier. The difference implies a 27% rise, primarily due to expenses related to travel activities and product improvement. However, a rise in the indirect taxes was also a major contributor.
