A Deeper Look at Valeant Pharmaceuticals’ Recent Financial Performance
In 3Q16, Valeant Pharmaceuticals (VRX) generated revenues of $2.4 billion, compared with $2.2 billion in 3Q17.
Feb. 9 2018, Updated 7:34 a.m. ET

VRX’s revenue trend
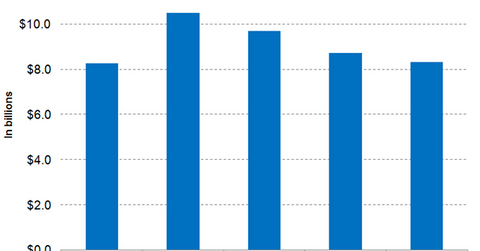
In 3Q16, Valeant Pharmaceuticals (VRX) generated revenues of $2.4 billion, compared with $2.2 billion in 3Q17. For fiscal 2017, Valeant Pharmaceuticals is expected to report revenues of $8.7 billion.
Expenses
Valeant’s cost of goods sold was relatively flat at $650 million in 3Q17, compared with $649 million in 3Q16. Its SG&A (selling, general, and administrative) expenses saw a marginal decline from $661 million in 3Q16 to $623 million in 3Q17.
Its R&D (research and development) expenses fell almost 20% from $101 million in 3Q16 to $81 million in 3Q17. Asset impairment charges increased from $148 million in 3Q16 to $406 million in 3Q17.
Valeant’s total operating expenses were $2.1 billion in 3Q17, compared with $3.3 billion in 3Q16. Major factors in this reduction included goodwill impairments, which fell from $1 billion in 3Q16 to $312 million in 3Q17.
As a result, Valeant Pharmaceuticals registered net income of $1.3 billion in 3Q17, compared with its net loss of $1.2 billion in 3Q16. This translated into net income per share of $3.69 in 3Q17, compared with its net loss per share of $3.49 in 3Q16.
Cash flows
Valeant Pharmaceuticals generated $1.7 billion from operating activities in the first three quarters of fiscal 2017, compared with $1.5 billion in the comparable period of fiscal 2016. While in the first three quarters of fiscal 2016, the company used up $131 million in investing activities, in the comparable period of fiscal 2017, the company generated $2.7 billion from investing activities.
This change was due to the sale of assets, which contributed $3 billion during the period.
Valeant focused on deleveraging and paying off $9.2 billion in debt in the first three quarters of fiscal 2017, compared with its repayments of $1.9 billion in the comparable period of fiscal 2016.
At the end of 3Q17, Valeant’s long-term debt stood at $26.4 billion. Its debt-to-equity ratio stood at 5.22. Peers Gilead Sciences (GILD), Horizon Pharmaceuticals (HZNP), and Jazz Pharmaceuticals (JAZZ) had debt-to-equity ratios of 1.18, 1.90, and 0.64, respectively.
Notably, Valeant Pharmaceuticals makes up about 0.02% of the Vanguard Total International Stock ETF’s (VXUS) total portfolio holdings.
